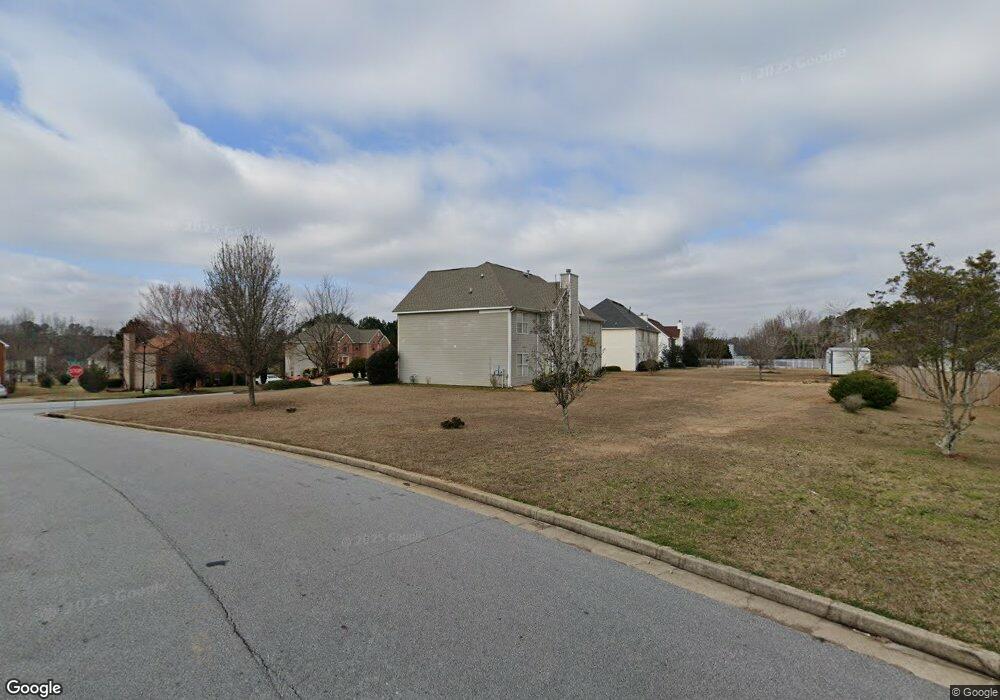
9688 Tyler Terrace Jonesboro, GA 30238
Estimated Value: $338,991 - $389,000
5
Beds
4
Baths
3,120
Sq Ft
$117/Sq Ft
Est. Value
About This Home
This home is located at 9688 Tyler Terrace, Jonesboro, GA 30238 and is currently estimated at $363,498, approximately $116 per square foot. 9688 Tyler Terrace is a home located in Clayton County with nearby schools including Brown Elementary School, Mundys Mill Middle School, and Mundy's Mill High School.
Ownership History
Date
Name
Owned For
Owner Type
Purchase Details
Closed on
Apr 28, 2020
Sold by
Nex Ventures Realty Inc
Bought by
Spencer Rosechell and Spencer Elizabeth P
Current Estimated Value
Home Financials for this Owner
Home Financials are based on the most recent Mortgage that was taken out on this home.
Original Mortgage
$229,992
Outstanding Balance
$203,805
Interest Rate
3.3%
Mortgage Type
VA
Estimated Equity
$159,693
Purchase Details
Closed on
Oct 29, 2019
Sold by
Chimera Reo 2018 Nr1 Llc
Bought by
Nex Ventures Realty Inc
Purchase Details
Closed on
Sep 3, 2019
Sold by
Black Rodney S
Bought by
Chimera Reo 2018 Nr1 Llc
Purchase Details
Closed on
Jun 30, 1999
Sold by
First Dimension Homes Inc
Bought by
Black Rodney S and Black Karla L
Home Financials for this Owner
Home Financials are based on the most recent Mortgage that was taken out on this home.
Original Mortgage
$166,150
Interest Rate
7.51%
Mortgage Type
FHA
Create a Home Valuation Report for This Property
The Home Valuation Report is an in-depth analysis detailing your home's value as well as a comparison with similar homes in the area
Home Values in the Area
Average Home Value in this Area
Purchase History
| Date | Buyer | Sale Price | Title Company |
|---|---|---|---|
| Spencer Rosechell | $222,000 | -- | |
| Nex Ventures Realty Inc | $156,975 | -- | |
| Chimera Reo 2018 Nr1 Llc | $140,339 | -- | |
| Black Rodney S | $166,300 | -- |
Source: Public Records
Mortgage History
| Date | Status | Borrower | Loan Amount |
|---|---|---|---|
| Open | Spencer Rosechell | $229,992 | |
| Previous Owner | Black Rodney S | $166,150 |
Source: Public Records
Tax History Compared to Growth
Tax History
| Year | Tax Paid | Tax Assessment Tax Assessment Total Assessment is a certain percentage of the fair market value that is determined by local assessors to be the total taxable value of land and additions on the property. | Land | Improvement |
|---|---|---|---|---|
| 2024 | $2,395 | $131,440 | $9,600 | $121,840 |
| 2023 | $4,746 | $131,440 | $9,600 | $121,840 |
| 2022 | $1,922 | $107,880 | $9,600 | $98,280 |
| 2021 | $3,424 | $85,720 | $9,600 | $76,120 |
| 2020 | $2,149 | $62,790 | $9,600 | $53,190 |
| 2019 | $2,347 | $66,866 | $8,800 | $58,066 |
| 2018 | $2,315 | $66,092 | $8,800 | $57,292 |
| 2017 | $1,990 | $57,983 | $8,800 | $49,183 |
| 2016 | $1,928 | $56,453 | $8,800 | $47,653 |
| 2015 | $2,155 | $0 | $0 | $0 |
| 2014 | $1,986 | $58,966 | $8,800 | $50,166 |
Source: Public Records
Map
Nearby Homes
- 9725 Tyler Terrace Unit 1
- 157 Tyler Ridge Unit II
- 0 Highway 54 Unit 10613856
- 230 Blue Heron Dr
- 9579 Fayetteville Rd
- 9579 Highway 54 W
- 9550 Canvasback Ct
- 9542 Canvasback Ct
- 226 Woodwind Way
- 9941 Musket Ridge Cir
- 9541 Canvasback Ct
- 304 Deerfield Dr
- 90 Inverness Trace
- 9430 Sleepy Hollow Ln
- 281 Willow Springs Dr
- 9716 Holly Hill Way
- 288 Country Club Dr
- 9404 Cypress Ln
- 155 Millers Oak Way
- 170 Inverness Trace
- 9680 Tyler Terrace
- 32 Tyler Ridge
- 9698 Tyler Terrace Unit 1
- 9685 Tyler Terrace Unit 1
- 9672 Tyler Terrace Unit 1
- 40 Tyler Ridge
- 9693 Tyler Terrace Unit 1
- 9677 Tyler Terrace Unit 3
- 45 Tyler Ridge
- 9706 Tyler Terrace Unit 1
- 9590 Tyler Terrace
- 9598 Tyler Terrace
- 9701 Tyler Terrace
- 48 Tyler Ridge
- 9582 Tyler Terrace Unit 3
- 9669 Tyler Terrace
- 9656 Tyler Terrace
- 9606 Tyler Terrace Unit 3
- 9709 Tyler Terrace Unit 1
- 9574 Tyler Terrace