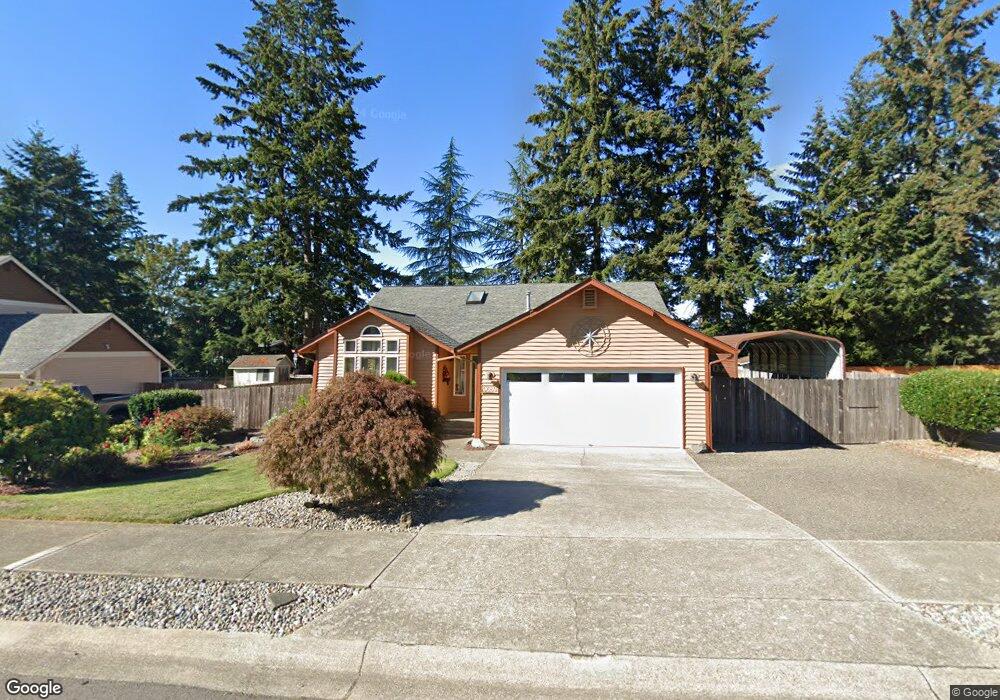
9689 Clipper Place NW Silverdale, WA 98383
Estimated Value: $450,000 - $509,000
3
Beds
2
Baths
1,435
Sq Ft
$342/Sq Ft
Est. Value
About This Home
This home is located at 9689 Clipper Place NW, Silverdale, WA 98383 and is currently estimated at $490,275, approximately $341 per square foot. 9689 Clipper Place NW is a home located in Kitsap County with nearby schools including Silver Ridge Elementary School, Ridgetop Middle School, and Central Kitsap High School.
Ownership History
Date
Name
Owned For
Owner Type
Purchase Details
Closed on
Oct 5, 2000
Sold by
Wetherbee Richard L and Wetherbee Lynda E
Bought by
Hoffmeister Jeffrey G and Hoffmeister Linda A
Current Estimated Value
Home Financials for this Owner
Home Financials are based on the most recent Mortgage that was taken out on this home.
Original Mortgage
$112,500
Outstanding Balance
$41,145
Interest Rate
7.96%
Estimated Equity
$449,130
Purchase Details
Closed on
May 26, 1999
Sold by
Stange John Raymond and Stange Jeanne Marie
Bought by
Wetherbee Richard L and Wetherbee Lynda E
Home Financials for this Owner
Home Financials are based on the most recent Mortgage that was taken out on this home.
Original Mortgage
$130,000
Interest Rate
6.86%
Purchase Details
Closed on
Dec 23, 1994
Sold by
Rowlands Warren D and Rowlands Kimberly A
Bought by
Stange John Raymond and Stange Jeanne Marie
Create a Home Valuation Report for This Property
The Home Valuation Report is an in-depth analysis detailing your home's value as well as a comparison with similar homes in the area
Home Values in the Area
Average Home Value in this Area
Purchase History
| Date | Buyer | Sale Price | Title Company |
|---|---|---|---|
| Hoffmeister Jeffrey G | $147,500 | Transnation Title Insurance | |
| Wetherbee Richard L | $134,900 | Pacific Northwest Title | |
| Stange John Raymond | -- | Stewart Title Company | |
| Stange John Raymond | $124,250 | Stewart Title | |
| Stange John Raymond | $124,250 | Stewart Title Company |
Source: Public Records
Mortgage History
| Date | Status | Borrower | Loan Amount |
|---|---|---|---|
| Open | Hoffmeister Jeffrey G | $112,500 | |
| Previous Owner | Wetherbee Richard L | $130,000 |
Source: Public Records
Tax History Compared to Growth
Tax History
| Year | Tax Paid | Tax Assessment Tax Assessment Total Assessment is a certain percentage of the fair market value that is determined by local assessors to be the total taxable value of land and additions on the property. | Land | Improvement |
|---|---|---|---|---|
| 2026 | $767 | $433,090 | $119,130 | $313,960 |
| 2025 | $767 | $433,090 | $119,130 | $313,960 |
| 2024 | $730 | $433,090 | $119,130 | $313,960 |
| 2023 | $735 | $410,300 | $125,400 | $284,900 |
| 2022 | $827 | $348,950 | $106,510 | $242,440 |
| 2021 | $3,532 | $320,720 | $97,450 | $223,270 |
| 2020 | $3,230 | $296,720 | $89,890 | $206,830 |
| 2019 | $3,089 | $274,850 | $83,090 | $191,760 |
| 2018 | $3,320 | $226,140 | $65,660 | $160,480 |
| 2017 | $2,909 | $226,140 | $65,660 | $160,480 |
| 2016 | $2,834 | $203,750 | $65,660 | $138,090 |
| 2015 | $2,714 | $203,750 | $65,660 | $138,090 |
| 2014 | -- | $192,550 | $65,660 | $126,890 |
| 2013 | -- | $192,550 | $65,660 | $126,890 |
Source: Public Records
Map
Nearby Homes
- 9757 Spinnaker Blvd NW
- 1737 NW Chena Rd
- 9695 Spinnaker Blvd NW
- 9619 Windswept Ln NW
- 9656 Sandy Isle Ln NW
- 9637 Fredrickson Rd NW
- 9388 Kristine Dr NW
- 922 Mahogany Ln NW
- 9310 Olson Rd NW
- 9428 Tracyton Blvd NW
- 10212 Ramble Dr NW
- 9302 Monte Vista Ln NW
- 981 Mahogany Ln NW
- 9155 Kristi Ct NW
- 910 NW Leisure Ln
- 9346 Nels Nelson Rd NW
- 1210 NW Huckle Dr
- 9102 Nels Nelson Rd NW
- 1940 NW Rustling Fir Ln
- 11163 Ridgepark Place NW
- 9982 N Olson Rd NW
- 9695 Clipper Place NW
- 9683 Clipper Place NW
- 9880 N Olson Rd NW
- 9686 Clipper Place NW
- 9692 Clipper Place NW
- 9892 Olson Rd NW
- 9844 N Olson Rd NW
- 9701 Clipper Place NW
- 9677 Clipper Place NW
- 9698 Clipper Place NW
- 9912 N Olson Rd NW
- 1568 NW Tradewinds St
- 1586 NW Tradewinds St
- 9663 Topsail Place NW
- 9796 N Olson Rd NW
- 9704 Clipper Place NW
- 9671 Clipper Place NW
- 1556 NW Tradewinds St
- 9948 N Olson Rd NW