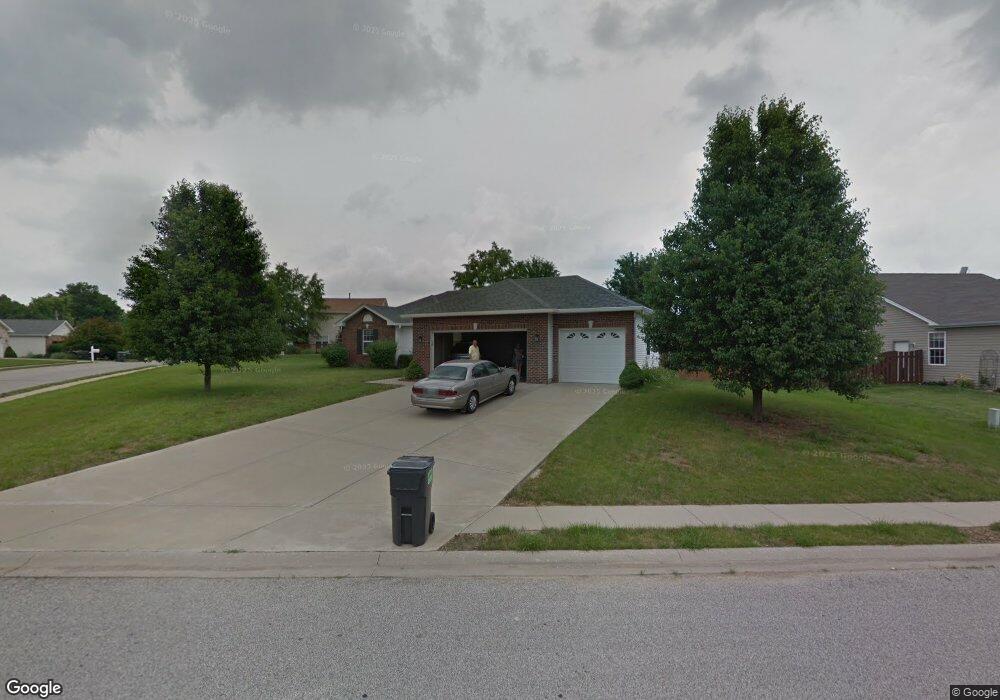
969 Blue Heron Ct Belleville, IL 62223
Estimated Value: $242,000 - $345,000
--
Bed
--
Bath
1,664
Sq Ft
$181/Sq Ft
Est. Value
About This Home
This home is located at 969 Blue Heron Ct, Belleville, IL 62223 and is currently estimated at $301,746, approximately $181 per square foot. 969 Blue Heron Ct is a home located in St. Clair County with nearby schools including Millstadt Primary Center, Millstadt Consolidated School, and Our Lady Queen Of Peace Catholic School.
Ownership History
Date
Name
Owned For
Owner Type
Purchase Details
Closed on
Mar 27, 2010
Sold by
Starwalt Jennifer
Bought by
Kaemmerer Richard and Starwalt Jennifer
Current Estimated Value
Home Financials for this Owner
Home Financials are based on the most recent Mortgage that was taken out on this home.
Original Mortgage
$185,439
Outstanding Balance
$118,453
Interest Rate
4.19%
Mortgage Type
FHA
Estimated Equity
$183,293
Purchase Details
Closed on
Dec 28, 2006
Sold by
Holley Julie
Bought by
Starwalt Jennifer
Home Financials for this Owner
Home Financials are based on the most recent Mortgage that was taken out on this home.
Original Mortgage
$35,600
Interest Rate
6.24%
Mortgage Type
Balloon
Purchase Details
Closed on
Mar 28, 2002
Sold by
Pagano Development Inc
Bought by
Holley Ronald E and Holley Darlene F
Create a Home Valuation Report for This Property
The Home Valuation Report is an in-depth analysis detailing your home's value as well as a comparison with similar homes in the area
Home Values in the Area
Average Home Value in this Area
Purchase History
| Date | Buyer | Sale Price | Title Company |
|---|---|---|---|
| Kaemmerer Richard | -- | Town & Country Title | |
| Starwalt Jennifer | $178,500 | Freedom Title | |
| Holley Ronald E | $155,500 | Benchmark Title Company |
Source: Public Records
Mortgage History
| Date | Status | Borrower | Loan Amount |
|---|---|---|---|
| Open | Kaemmerer Richard | $185,439 | |
| Closed | Starwalt Jennifer | $35,600 | |
| Closed | Starwalt Jennifer | $142,450 |
Source: Public Records
Tax History Compared to Growth
Tax History
| Year | Tax Paid | Tax Assessment Tax Assessment Total Assessment is a certain percentage of the fair market value that is determined by local assessors to be the total taxable value of land and additions on the property. | Land | Improvement |
|---|---|---|---|---|
| 2024 | $5,416 | $81,937 | $19,230 | $62,707 |
| 2023 | $5,051 | $73,519 | $17,254 | $56,265 |
| 2022 | $4,749 | $66,714 | $15,657 | $51,057 |
| 2021 | $4,554 | $61,938 | $14,536 | $47,402 |
| 2020 | $4,592 | $60,805 | $14,142 | $46,663 |
| 2019 | $4,527 | $60,805 | $14,142 | $46,663 |
| 2018 | $4,358 | $58,104 | $13,514 | $44,590 |
| 2017 | $3,922 | $54,113 | $12,586 | $41,527 |
| 2016 | $3,633 | $56,337 | $11,956 | $44,381 |
| 2014 | $3,866 | $56,660 | $12,025 | $44,635 |
| 2013 | $4,105 | $60,450 | $12,829 | $47,621 |
Source: Public Records
Map
Nearby Homes
- 967 Hidden Cove
- 29 Cat Tail Ct
- 2 Dottie Dr
- 632 Fern Dr
- 631 Monica Dr
- 400 Conniston Dr
- 621 Eiler Rd
- 636 Fern Dr
- 517 Belvedere Dr
- 512 Belvedere Dr
- 510 Fern Dr
- 613 Sunnyhill Dr
- 107 Howard Dr
- 109 Cascade Dr
- 100 Cascade Dr
- 109 Eiler Rd
- 8310 Old Saint Louis Rd
- 8100 Excellence Place
- 8620 State Route 163
- 809 Stone Creek Ln