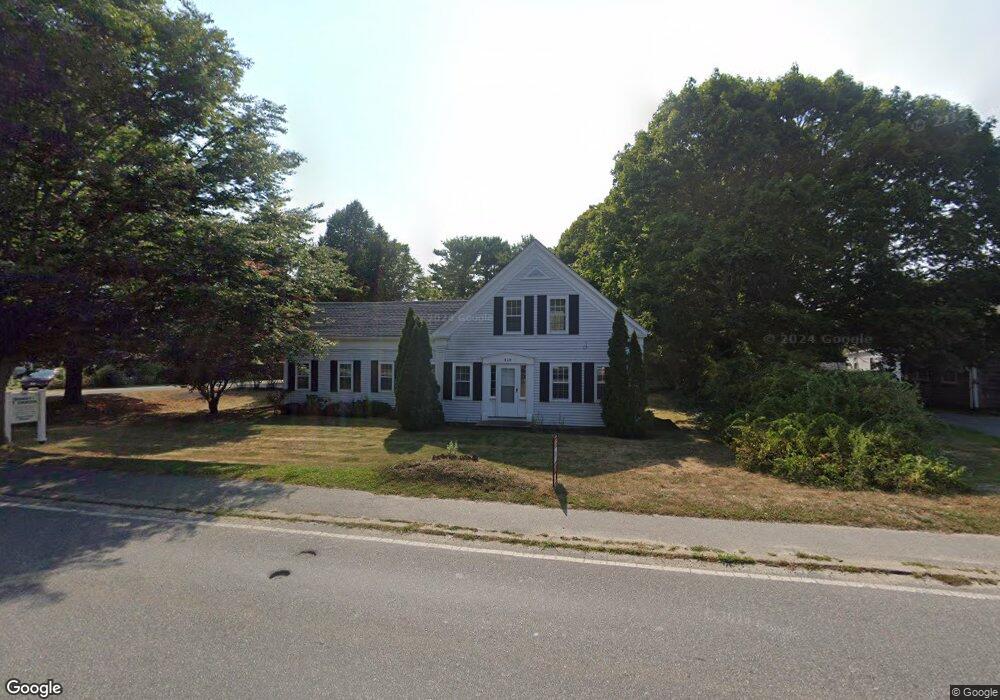
969 Main St Barnstable, MA 02655
Osterville NeighborhoodEstimated Value: $1,447,541
1
Bed
3
Baths
2,148
Sq Ft
$674/Sq Ft
Est. Value
About This Home
This home is located at 969 Main St, Barnstable, MA 02655 and is currently estimated at $1,447,541, approximately $673 per square foot. 969 Main St is a home located in Barnstable County with nearby schools including West Villages Elementary School, Barnstable United Elementary School, and Barnstable Intermediate School.
Ownership History
Date
Name
Owned For
Owner Type
Purchase Details
Closed on
Jul 25, 2020
Sold by
Captain Small House Rt 2 and Hostetter
Bought by
Td Rt and Hostetter
Current Estimated Value
Purchase Details
Closed on
Mar 7, 2002
Sold by
Jonathan Sm House Rt
Bought by
Captain Sm House Rt2nd
Home Financials for this Owner
Home Financials are based on the most recent Mortgage that was taken out on this home.
Original Mortgage
$300,000
Interest Rate
7.01%
Mortgage Type
Commercial
Create a Home Valuation Report for This Property
The Home Valuation Report is an in-depth analysis detailing your home's value as well as a comparison with similar homes in the area
Home Values in the Area
Average Home Value in this Area
Purchase History
| Date | Buyer | Sale Price | Title Company |
|---|---|---|---|
| Td Rt | -- | None Available | |
| Td Rt | -- | None Available | |
| Captain Sm House Rt2nd | $500,000 | -- |
Source: Public Records
Mortgage History
| Date | Status | Borrower | Loan Amount |
|---|---|---|---|
| Previous Owner | Captain Sm House Rt2nd | $224,980 | |
| Previous Owner | Captain Sm House Rt2nd | $300,000 | |
| Previous Owner | Captain Sm House Rt2nd | $100,000 |
Source: Public Records
Tax History
| Year | Tax Paid | Tax Assessment Tax Assessment Total Assessment is a certain percentage of the fair market value that is determined by local assessors to be the total taxable value of land and additions on the property. | Land | Improvement |
|---|---|---|---|---|
| 2025 | $3,884 | $535,700 | $380,900 | $154,800 |
| 2024 | $3,762 | $531,400 | $380,900 | $150,500 |
| 2023 | $4,092 | $531,400 | $380,900 | $150,500 |
| 2022 | $4,141 | $467,900 | $317,400 | $150,500 |
| 2021 | $4,515 | $467,900 | $317,400 | $150,500 |
| 2020 | $4,143 | $410,200 | $277,000 | $133,200 |
| 2019 | $4,269 | $410,900 | $277,000 | $133,900 |
| 2018 | $4,198 | $406,800 | $277,000 | $129,800 |
| 2017 | $4,199 | $425,900 | $277,000 | $148,900 |
| 2016 | $4,259 | $425,900 | $277,000 | $148,900 |
| 2015 | $4,303 | $432,500 | $291,600 | $140,900 |
Source: Public Records
Map
Nearby Homes
- 39 Blossom Ave Unit 4
- 920 Main St Unit 1 Building 2
- 920 Main St Unit 2-1
- 67 Fire Station Rd
- 39 Tower Hill Rd Unit 1C
- 29 Oak Ridge Rd
- 33 Sunset Ln
- 40 Waterfield Rd
- 98 Bunker Hill Rd
- 77 Robbins St
- 146 Scudder Rd
- 369 Bumps River Rd
- 16 2nd Ave Unit 4
- 117 Parsley Ln
- 51 Wianno Cir
- 280 Ice Valley Rd
- 351 Swift Ave
- 89 Swift Ave
- 207 Crystal Lake Rd
- 71 Sand Point
Your Personal Tour Guide
Ask me questions while you tour the home.