Estimated Value: $362,000 - $443,000
6
Beds
3
Baths
3,406
Sq Ft
$116/Sq Ft
Est. Value
About This Home
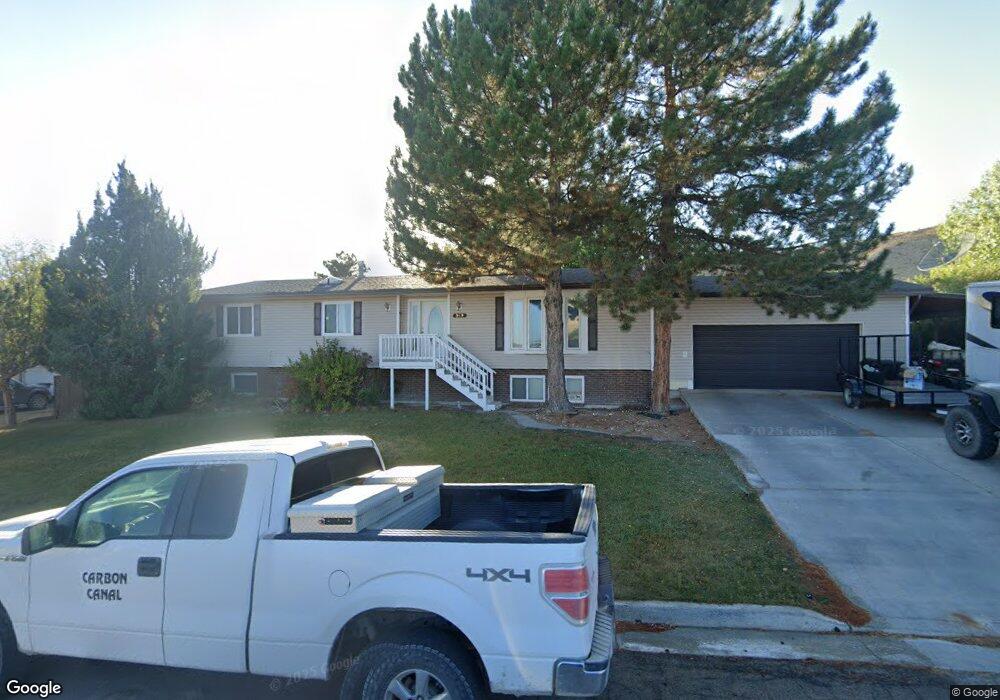
This home is located at 969 N 100 E, Price, UT 84501 and is currently estimated at $396,286, approximately $116 per square foot. 969 N 100 E is a home located in Carbon County with nearby schools including Castle Heights School, Mont Harmon Junior High School, and Carbon High School.
Ownership History
Date
Name
Owned For
Owner Type
Purchase Details
Closed on
May 15, 2017
Sold by
Beall Olsen Micheal Chester and Beall Olsen Julie
Bought by
Turner Lisa D
Current Estimated Value
Home Financials for this Owner
Home Financials are based on the most recent Mortgage that was taken out on this home.
Original Mortgage
$208,650
Outstanding Balance
$173,818
Interest Rate
4.25%
Mortgage Type
FHA
Estimated Equity
$222,468
Create a Home Valuation Report for This Property
The Home Valuation Report is an in-depth analysis detailing your home's value as well as a comparison with similar homes in the area
Purchase History
| Date | Buyer | Sale Price | Title Company |
|---|---|---|---|
| Turner Lisa D | -- | South Eastern Utah Title Co |
Source: Public Records
Mortgage History
| Date | Status | Borrower | Loan Amount |
|---|---|---|---|
| Open | Turner Lisa D | $208,650 |
Source: Public Records
Tax History
| Year | Tax Paid | Tax Assessment Tax Assessment Total Assessment is a certain percentage of the fair market value that is determined by local assessors to be the total taxable value of land and additions on the property. | Land | Improvement |
|---|---|---|---|---|
| 2025 | $2,963 | $243,871 | $20,913 | $222,958 |
| 2024 | $2,160 | $179,833 | $16,005 | $163,828 |
| 2023 | $2,053 | $182,327 | $21,963 | $160,364 |
| 2022 | $2,137 | $170,257 | $18,261 | $151,996 |
| 2021 | $1,846 | $228,159 | $27,900 | $200,259 |
| 2020 | $1,813 | $112,494 | $0 | $0 |
| 2019 | $1,617 | $105,223 | $0 | $0 |
| 2018 | $1,715 | $113,851 | $0 | $0 |
| 2017 | $1,694 | $113,851 | $0 | $0 |
| 2016 | $1,790 | $113,851 | $0 | $0 |
| 2015 | $1,790 | $133,375 | $0 | $0 |
| 2014 | $1,778 | $133,375 | $0 | $0 |
| 2013 | $1,455 | $108,088 | $0 | $0 |
Source: Public Records
Map
Nearby Homes
Your Personal Tour Guide
Ask me questions while you tour the home.