Estimated Value: $125,000 - $160,000
3
Beds
1
Bath
816
Sq Ft
$176/Sq Ft
Est. Value
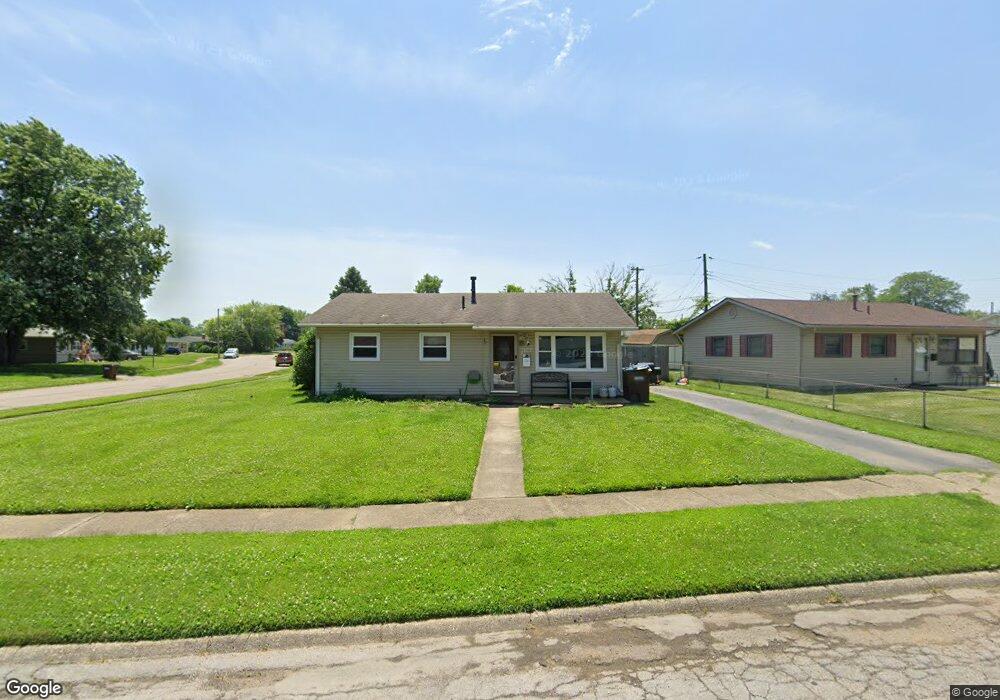
About This Home
This home is located at 969 Omard Dr, Xenia, OH 45385 and is currently estimated at $143,953, approximately $176 per square foot. 969 Omard Dr is a home located in Greene County with nearby schools including Xenia High School, Summit Academy Community School for Alternative Learners - Xenia, and Legacy Christian Academy.
Ownership History
Date
Name
Owned For
Owner Type
Purchase Details
Closed on
Oct 27, 2017
Sold by
Richards Stephen L and Richards Phyllis J
Bought by
Garrison Robin L
Current Estimated Value
Home Financials for this Owner
Home Financials are based on the most recent Mortgage that was taken out on this home.
Original Mortgage
$56,950
Outstanding Balance
$47,696
Interest Rate
3.83%
Mortgage Type
New Conventional
Estimated Equity
$96,257
Purchase Details
Closed on
Sep 12, 2014
Sold by
Richards Stephen L and Richards Phyllis J
Bought by
Richards Stephen L and Richards Phyllis J
Create a Home Valuation Report for This Property
The Home Valuation Report is an in-depth analysis detailing your home's value as well as a comparison with similar homes in the area
Home Values in the Area
Average Home Value in this Area
Purchase History
| Date | Buyer | Sale Price | Title Company |
|---|---|---|---|
| Garrison Robin L | $67,000 | -- | |
| Richards Stephen L | -- | None Available |
Source: Public Records
Mortgage History
| Date | Status | Borrower | Loan Amount |
|---|---|---|---|
| Open | Garrison Robin L | $56,950 |
Source: Public Records
Tax History Compared to Growth
Tax History
| Year | Tax Paid | Tax Assessment Tax Assessment Total Assessment is a certain percentage of the fair market value that is determined by local assessors to be the total taxable value of land and additions on the property. | Land | Improvement |
|---|---|---|---|---|
| 2024 | $1,459 | $34,110 | $9,390 | $24,720 |
| 2023 | $1,459 | $34,110 | $9,390 | $24,720 |
| 2022 | $1,205 | $24,020 | $6,710 | $17,310 |
| 2021 | $1,221 | $24,020 | $6,710 | $17,310 |
| 2020 | $1,170 | $24,020 | $6,710 | $17,310 |
| 2019 | $1,076 | $20,790 | $4,640 | $16,150 |
| 2018 | $1,080 | $20,790 | $4,640 | $16,150 |
| 2017 | $1,037 | $20,790 | $4,640 | $16,150 |
| 2016 | $1,037 | $19,590 | $4,640 | $14,950 |
| 2015 | $1,040 | $19,590 | $4,640 | $14,950 |
| 2014 | $484 | $19,590 | $4,640 | $14,950 |
Source: Public Records
Map
Nearby Homes