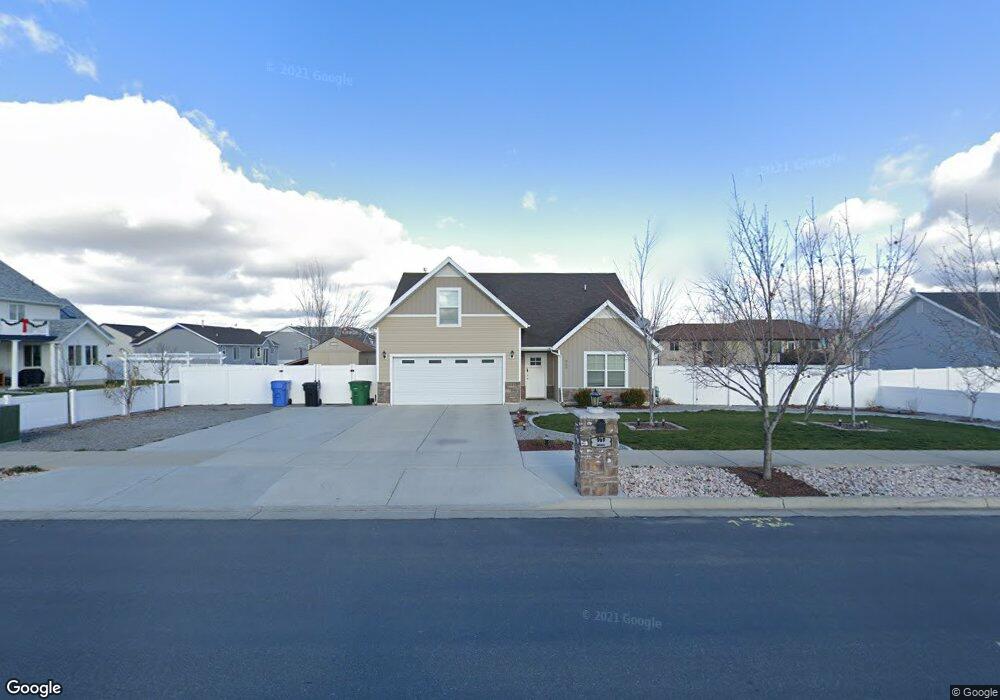
969 W 2600 S Nibley, UT 84321
Estimated Value: $482,000 - $509,000
4
Beds
2
Baths
1,886
Sq Ft
$263/Sq Ft
Est. Value
About This Home
This home is located at 969 W 2600 S, Nibley, UT 84321 and is currently estimated at $496,059, approximately $263 per square foot. 969 W 2600 S is a home located in Cache County with nearby schools including Nibley School, Spring Creek Middle School, and South Cache Middle School.
Ownership History
Date
Name
Owned For
Owner Type
Purchase Details
Closed on
Aug 10, 2015
Sold by
Larson William and Larson Margy
Bought by
Larson William and Larson Marguerite
Current Estimated Value
Home Financials for this Owner
Home Financials are based on the most recent Mortgage that was taken out on this home.
Original Mortgage
$220,029
Outstanding Balance
$172,697
Interest Rate
4.05%
Mortgage Type
VA
Estimated Equity
$323,362
Purchase Details
Closed on
Feb 20, 2013
Sold by
Larson William
Bought by
Larson William and Larson Margy
Home Financials for this Owner
Home Financials are based on the most recent Mortgage that was taken out on this home.
Original Mortgage
$188,977
Interest Rate
3.36%
Mortgage Type
VA
Purchase Details
Closed on
Dec 12, 2012
Sold by
Gibbons Family Investment Properties Llc
Bought by
Gibbons Family Investment Company Llc
Purchase Details
Closed on
Aug 13, 2012
Sold by
Gibbons Family Investments Company Llc
Bought by
Solid Homes Inc and Lifestyle Homes
Home Financials for this Owner
Home Financials are based on the most recent Mortgage that was taken out on this home.
Original Mortgage
$156,200
Interest Rate
10%
Mortgage Type
Purchase Money Mortgage
Purchase Details
Closed on
May 8, 2012
Sold by
Gibbons Cindy Kay
Bought by
Gibbons Family Investment Properties Llc
Purchase Details
Closed on
Nov 8, 2006
Sold by
Landmark Companies Inc
Bought by
Gibbons Family Investment Company Llc
Create a Home Valuation Report for This Property
The Home Valuation Report is an in-depth analysis detailing your home's value as well as a comparison with similar homes in the area
Home Values in the Area
Average Home Value in this Area
Purchase History
| Date | Buyer | Sale Price | Title Company |
|---|---|---|---|
| Larson William | -- | Hickman Land Title Company | |
| Larson William | -- | Hickman Land Title Company | |
| Larson William | -- | Hickman Land Title Company | |
| Gibbons Family Investment Company Llc | -- | Cache Title Logan | |
| Solid Homes Inc | -- | Hickman Land Title Company | |
| Gibbons Family Investment Properties Llc | -- | Cache Title Company | |
| Gibbons Family Investment Company Llc | -- | Cache Title Company |
Source: Public Records
Mortgage History
| Date | Status | Borrower | Loan Amount |
|---|---|---|---|
| Open | Larson William | $220,029 | |
| Closed | Larson William | $188,977 | |
| Previous Owner | Solid Homes Inc | $156,200 |
Source: Public Records
Tax History Compared to Growth
Tax History
| Year | Tax Paid | Tax Assessment Tax Assessment Total Assessment is a certain percentage of the fair market value that is determined by local assessors to be the total taxable value of land and additions on the property. | Land | Improvement |
|---|---|---|---|---|
| 2025 | $2,066 | $273,915 | $0 | $0 |
| 2024 | $219 | $272,135 | $0 | $0 |
| 2023 | $2,284 | $266,200 | $0 | $0 |
| 2022 | $2,378 | $266,200 | $0 | $0 |
| 2021 | $1,691 | $293,961 | $65,000 | $228,961 |
| 2020 | $1,595 | $264,097 | $65,000 | $199,097 |
| 2019 | $1,673 | $264,096 | $65,000 | $199,096 |
| 2018 | $1,447 | $222,765 | $45,000 | $177,765 |
| 2017 | $1,445 | $117,865 | $0 | $0 |
| 2016 | $1,461 | $103,345 | $0 | $0 |
| 2015 | $1,273 | $103,345 | $0 | $0 |
| 2014 | $1,244 | $103,345 | $0 | $0 |
| 2013 | -- | $88,860 | $0 | $0 |
Source: Public Records
Map
Nearby Homes