9691 Cordova Rd Easton, MD 21601
Estimated Value: $323,000 - $481,000
--
Bed
3
Baths
2,000
Sq Ft
$210/Sq Ft
Est. Value
About This Home
This home is located at 9691 Cordova Rd, Easton, MD 21601 and is currently estimated at $420,255, approximately $210 per square foot. 9691 Cordova Rd is a home located in Talbot County with nearby schools including Chapel District Elementary School, Easton Middle School, and Easton High School.
Ownership History
Date
Name
Owned For
Owner Type
Purchase Details
Closed on
Dec 30, 2022
Sold by
Mathias Lon J
Bought by
Mathias Jeffrey and Mathias Susan
Current Estimated Value
Purchase Details
Closed on
Oct 15, 2021
Sold by
Horner Tyler N and Horner Robert A
Bought by
Kma Talbot Llc
Home Financials for this Owner
Home Financials are based on the most recent Mortgage that was taken out on this home.
Original Mortgage
$359,682
Interest Rate
2.8%
Mortgage Type
Commercial
Purchase Details
Closed on
Mar 9, 2009
Sold by
Horner Robert A
Bought by
Horner Robert A
Purchase Details
Closed on
Mar 28, 2006
Sold by
Spies Henry A and Spies Cynthia L
Bought by
Horner Robert A and Horner Adell T
Purchase Details
Closed on
Mar 24, 2006
Sold by
Spies Henry A and Spies Cynthia L
Bought by
Horner Robert A and Horner Adell T
Purchase Details
Closed on
Jun 5, 1997
Sold by
Saathoff Barbara P
Bought by
Spies Henry A and Spies Cynthia L
Create a Home Valuation Report for This Property
The Home Valuation Report is an in-depth analysis detailing your home's value as well as a comparison with similar homes in the area
Home Values in the Area
Average Home Value in this Area
Purchase History
| Date | Buyer | Sale Price | Title Company |
|---|---|---|---|
| Mathias Jeffrey | -- | -- | |
| Kma Talbot Llc | $350,000 | First American Title Ins Co | |
| Horner Robert A | -- | -- | |
| Horner Robert A | $300,000 | -- | |
| Horner Robert A | $300,000 | -- | |
| Spies Henry A | $65,000 | -- |
Source: Public Records
Mortgage History
| Date | Status | Borrower | Loan Amount |
|---|---|---|---|
| Previous Owner | Kma Talbot Llc | $359,682 |
Source: Public Records
Tax History Compared to Growth
Tax History
| Year | Tax Paid | Tax Assessment Tax Assessment Total Assessment is a certain percentage of the fair market value that is determined by local assessors to be the total taxable value of land and additions on the property. | Land | Improvement |
|---|---|---|---|---|
| 2025 | $2,291 | $262,300 | $0 | $0 |
| 2024 | $2,291 | $249,200 | $80,300 | $168,900 |
| 2023 | $2,154 | $247,000 | $0 | $0 |
| 2022 | $1,987 | $244,800 | $0 | $0 |
| 2021 | $3,937 | $242,600 | $85,800 | $156,800 |
| 2020 | $1,807 | $233,200 | $0 | $0 |
| 2019 | $1,722 | $223,800 | $0 | $0 |
| 2018 | $1,524 | $214,400 | $85,800 | $128,600 |
| 2017 | $1,473 | $214,400 | $0 | $0 |
| 2016 | $1,488 | $214,400 | $0 | $0 |
| 2015 | $1,508 | $222,200 | $0 | $0 |
| 2014 | $1,508 | $222,200 | $0 | $0 |
Source: Public Records
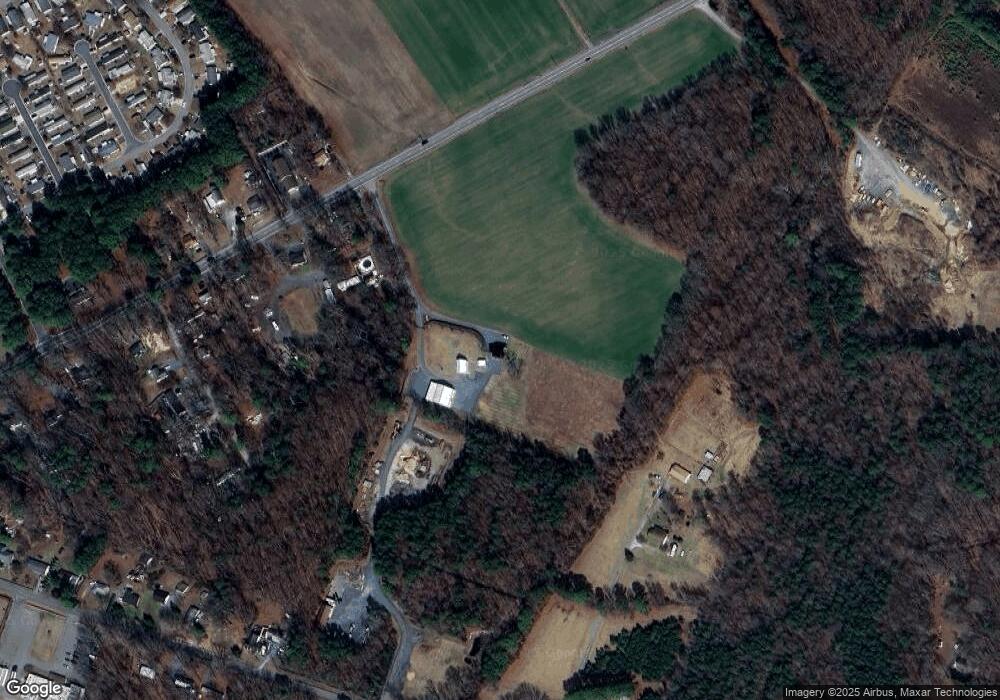
Map
Nearby Homes
- 12 Curzon Ct
- 12 Park Ln
- 11 Park Ln
- Lot 12 Price St
- 29 Kensington Dr
- 9236 Chapel Rd
- 0 Cordova Rd Unit MDTA2009734
- 0 Ocean Gateway Unit MDTA2009628
- 0 Ocean Gateway Unit MDTA2008568
- 9134 Honeysuckle Dr
- 9043 Ocean Gateway
- 10118 Hiners Ln
- 29414 Andrew Ln
- 8740 Harper Way
- 8745 Harper Way
- 8742 Harper Way
- 8736 Harper Way
- 29890 Londyn Ln
- 29888 Londyn Ln
- 29656 Meadow Gate Dr
- 9687 Cordova Rd
- 9687 Cordova Rd
- 9687 Cordova Rd
- 9621 Tall Oaks Rd
- 9681 Cordova Rd
- 9679 Cordova Rd
- 9669 Cordova Rd
- 9659 Cordova Rd
- 9603 Tall Oaks Rd
- 9655 Cordova Rd
- 9529 Black Dog Alley
- 9577 Entrance Ln
- 9643 Tall Oaks Rd
- 9690 Cordova Rd
- 9678 Cordova Rd
- 9628 Tall Oaks Rd
- 9670 Cordova Rd
- 9632 Tall Oaks Rd
- 9537 Black Dog Alley
- 9662 Cordova Rd