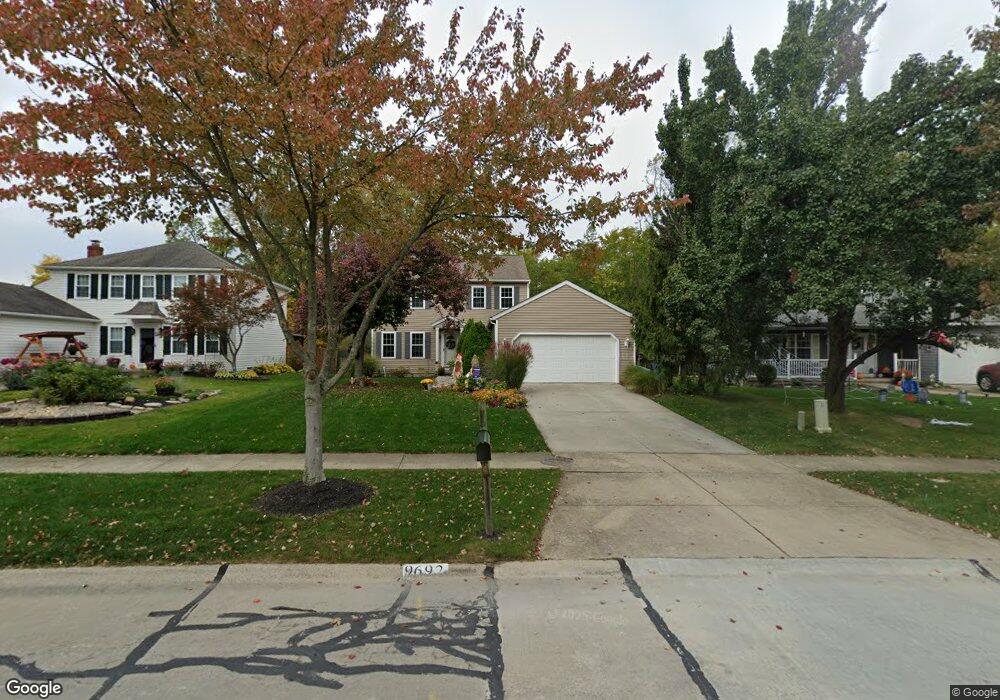
9692 Grist Mill Run Olmsted Falls, OH 44138
Estimated Value: $342,000 - $410,000
4
Beds
3
Baths
2,564
Sq Ft
$146/Sq Ft
Est. Value
About This Home
This home is located at 9692 Grist Mill Run, Olmsted Falls, OH 44138 and is currently estimated at $375,557, approximately $146 per square foot. 9692 Grist Mill Run is a home located in Cuyahoga County with nearby schools including Falls-Lenox Primary Elementary School, Olmsted Falls Intermediate Building, and Olmsted Falls Middle School.
Ownership History
Date
Name
Owned For
Owner Type
Purchase Details
Closed on
Sep 16, 2010
Sold by
Krauss Donald W and Krauss Ted C
Bought by
Zoscak Emily A and Zoscak Michael F
Current Estimated Value
Home Financials for this Owner
Home Financials are based on the most recent Mortgage that was taken out on this home.
Original Mortgage
$190,089
Outstanding Balance
$125,903
Interest Rate
4.5%
Mortgage Type
FHA
Estimated Equity
$249,654
Purchase Details
Closed on
Feb 10, 2009
Sold by
Fannie Mae
Bought by
Krauss Donald W and Krauss Ted C
Purchase Details
Closed on
Sep 10, 2008
Sold by
Soros Carl and Soros Cynthia
Bought by
Federal National Mortgage Association
Purchase Details
Closed on
Jul 13, 1988
Bought by
Soros Carl J
Purchase Details
Closed on
Jan 1, 1988
Bought by
Shorewest Const Co
Create a Home Valuation Report for This Property
The Home Valuation Report is an in-depth analysis detailing your home's value as well as a comparison with similar homes in the area
Home Values in the Area
Average Home Value in this Area
Purchase History
| Date | Buyer | Sale Price | Title Company |
|---|---|---|---|
| Zoscak Emily A | $199,900 | Barristers Title Agency | |
| Krauss Donald W | $97,000 | Accutitle Agency Inc | |
| Federal National Mortgage Association | $88,667 | None Available | |
| Soros Carl J | $115,900 | -- | |
| Shorewest Const Co | -- | -- |
Source: Public Records
Mortgage History
| Date | Status | Borrower | Loan Amount |
|---|---|---|---|
| Open | Zoscak Emily A | $190,089 |
Source: Public Records
Tax History Compared to Growth
Tax History
| Year | Tax Paid | Tax Assessment Tax Assessment Total Assessment is a certain percentage of the fair market value that is determined by local assessors to be the total taxable value of land and additions on the property. | Land | Improvement |
|---|---|---|---|---|
| 2024 | $7,054 | $109,025 | $16,485 | $92,540 |
| 2023 | $6,494 | $82,180 | $15,190 | $66,990 |
| 2022 | $6,444 | $82,180 | $15,190 | $66,990 |
| 2021 | $6,380 | $82,180 | $15,190 | $66,990 |
| 2020 | $6,300 | $72,100 | $13,340 | $58,770 |
| 2019 | $5,592 | $206,000 | $38,100 | $167,900 |
| 2018 | $5,578 | $72,100 | $13,340 | $58,770 |
| 2017 | $5,826 | $69,720 | $10,290 | $59,430 |
| 2016 | $5,798 | $69,720 | $10,290 | $59,430 |
| 2015 | $5,617 | $69,720 | $10,290 | $59,430 |
| 2014 | $5,617 | $65,770 | $9,700 | $56,070 |
Source: Public Records
Map
Nearby Homes
- 23514 Grist Mill Ct Unit 4
- 23390 Wainwright Terrace
- 9855 Dupont Dr
- 549 Wyleswood Dr
- 543 Wyleswood Dr
- 537 Wyleswood Dr
- 9797 Sugarbush Cir
- 23155 Wainwright Terrace
- V/L Aldridge Dr
- 23002 Chandlers Ln
- 23002 Chandlers Ln Unit 342
- 23002 Chandlers Ln Unit 221
- 23003 Chandlers Ln Unit 219
- 23003 Chandlers Ln Unit 230
- 396 Crossbrook Dr
- 24628 Sprague Rd
- 647 Tampico Ct Unit 7
- 8809 Leatherleaf Dr
- 412 Wyleswood Dr
- 8757 Roberts Ct Unit 25C
- 9696 Grist Mill Run
- 9688 Grist Mill Run
- 9700 Grist Mill Run
- 9684 Grist Mill Run
- 9693 Grist Mill Run
- 9704 Grist Mill Run
- 9680 Grist Mill Run
- 9697 Grist Mill Run
- 9701 Grist Mill Run
- 9689 Grist Mill Run
- 9708 Grist Mill Run
- 9676 Grist Mill Run
- 9705 Grist Mill Run
- 9708 Tannery Way
- 9712 Grist Mill Run
- 9672 Grist Mill Run
- 23742 Sawmill Bend
- 9712 Tannery Way
- 9704 Tannery Way
- 9716 Tannery Way