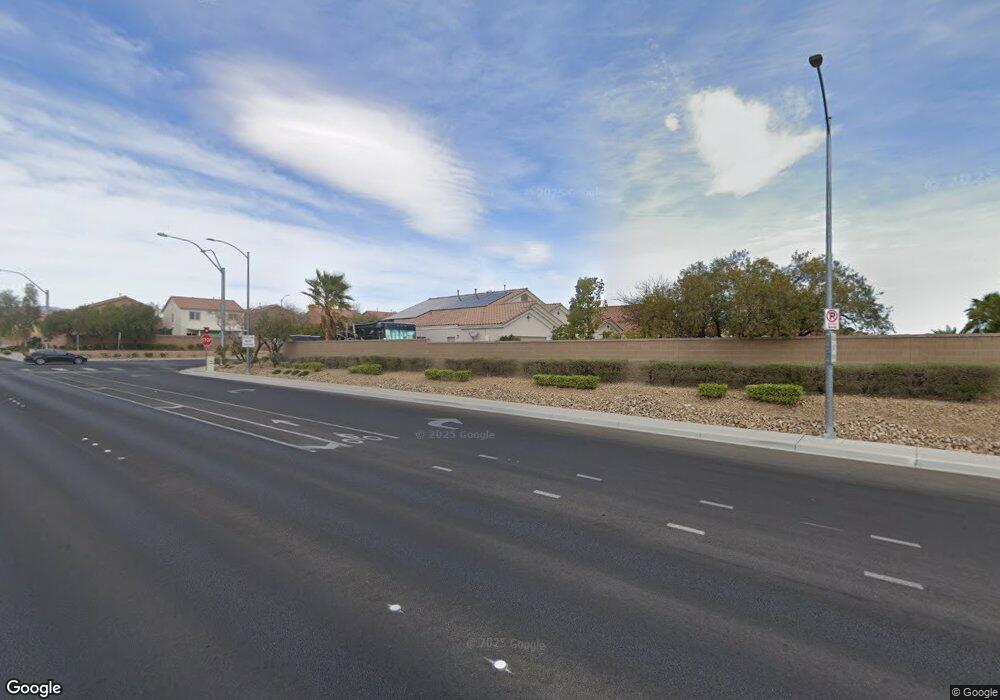
9693 Dancing Pond Way Las Vegas, NV 89178
Mountains Edge NeighborhoodEstimated Value: $614,000 - $687,000
5
Beds
3
Baths
2,562
Sq Ft
$253/Sq Ft
Est. Value
About This Home
This home is located at 9693 Dancing Pond Way, Las Vegas, NV 89178 and is currently estimated at $647,259, approximately $252 per square foot. 9693 Dancing Pond Way is a home located in Clark County with nearby schools including William V. Wright Elementary School, Desert Oasis High School, and Doral Academy Cactus.
Ownership History
Date
Name
Owned For
Owner Type
Purchase Details
Closed on
Feb 8, 2005
Sold by
D R Horton Inc
Bought by
Proia Raymond J and Proia Anne R
Current Estimated Value
Home Financials for this Owner
Home Financials are based on the most recent Mortgage that was taken out on this home.
Original Mortgage
$386,977
Outstanding Balance
$181,918
Interest Rate
4.62%
Estimated Equity
$465,341
Create a Home Valuation Report for This Property
The Home Valuation Report is an in-depth analysis detailing your home's value as well as a comparison with similar homes in the area
Home Values in the Area
Average Home Value in this Area
Purchase History
| Date | Buyer | Sale Price | Title Company |
|---|---|---|---|
| Proia Raymond J | $483,722 | Chicago Title |
Source: Public Records
Mortgage History
| Date | Status | Borrower | Loan Amount |
|---|---|---|---|
| Open | Proia Raymond J | $386,977 |
Source: Public Records
Tax History Compared to Growth
Tax History
| Year | Tax Paid | Tax Assessment Tax Assessment Total Assessment is a certain percentage of the fair market value that is determined by local assessors to be the total taxable value of land and additions on the property. | Land | Improvement |
|---|---|---|---|---|
| 2025 | $2,818 | $188,671 | $57,750 | $130,921 |
| 2024 | $2,834 | $188,671 | $57,750 | $130,921 |
| 2023 | $2,834 | $173,128 | $50,050 | $123,078 |
| 2022 | $2,752 | $160,260 | $48,125 | $112,135 |
| 2021 | $2,672 | $148,698 | $42,000 | $106,698 |
| 2020 | $2,591 | $137,080 | $36,750 | $100,330 |
| 2019 | $2,516 | $135,402 | $31,500 | $103,902 |
| 2018 | $2,442 | $127,940 | $28,000 | $99,940 |
| 2017 | $3,405 | $116,095 | $25,200 | $90,895 |
| 2016 | $2,313 | $103,379 | $19,250 | $84,129 |
| 2015 | $2,308 | $81,208 | $16,100 | $65,108 |
| 2014 | $2,241 | $81,078 | $10,500 | $70,578 |
Source: Public Records
Map
Nearby Homes
- 9664 Toy Soldier St
- 9076 Bridal Creek Ave
- 9123 Weeping Hollow Ave
- 9534 Twister Trace St
- 9165 Cantina Creek Ct
- 9431 Mad Dog St
- 9427 Liquid Loco St
- 9161 Dutch Oven Ct
- 8964 Tom Noon Ave
- 9402 Crimson Sky St
- 9856 Chief Sky St
- 9466 Marshall Creek St
- 9825 Emerald Twilight St
- 9145 Sunken Meadow Ave
- 9341 Sea Captain St
- 9141 Castle Valley Ave
- 8809 Horizon Wind Ave Unit 102
- 8817 Tom Noon Ave Unit 103
- 9846 Black Mulberry St
- 9864 Maspalomas St
- 9681 Dancing Pond Way
- 9669 Dancing Pond Way
- 9692 Dancing Pond Way
- 9680 Dancing Pond Way
- 9686 Bouncing Ball St Unit Lot 44
- 9686 Bouncing Ball St
- 9680 Bouncing Ball St
- 9680 Bouncing Ball St Unit n/a
- 9674 Bouncing Ball St
- 9657 Dancing Pond Way
- 9692 Bouncing Ball St
- 9668 Dancing Pond Way
- 8996 Oceanside Slopes Ave
- 8988 Oceanside Slopes Ave
- 8988 Oceanside Slopes Ave
- 8988 Oceanside Slopes Ave
- 8988 Oceanside Slopes Ave
- 9668 Bouncing Ball St Unit Lot 47
- 9668 Bouncing Ball St
- 8980 Oceanside Slopes Ave
