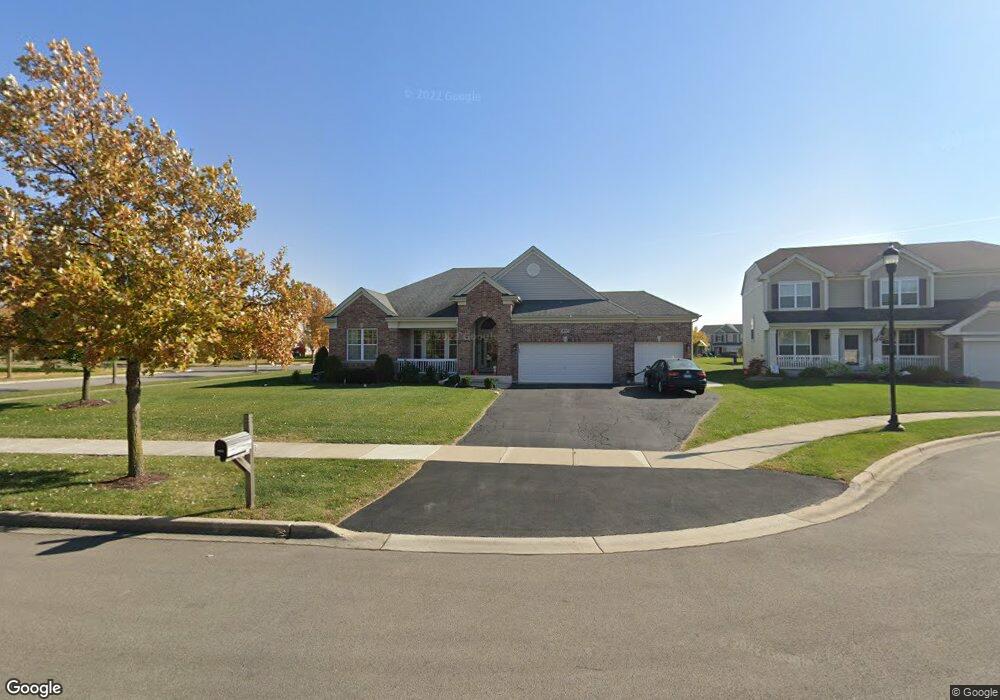
9693 Dover Ct Huntley, IL 60142
Estimated Value: $460,000 - $551,000
3
Beds
3
Baths
2,463
Sq Ft
$198/Sq Ft
Est. Value
About This Home
This home is located at 9693 Dover Ct, Huntley, IL 60142 and is currently estimated at $487,496, approximately $197 per square foot. 9693 Dover Ct is a home located in McHenry County with nearby schools including Chesak Elementary School, Martin Elementary School, and Marlowe Middle School.
Ownership History
Date
Name
Owned For
Owner Type
Purchase Details
Closed on
Mar 7, 2021
Sold by
Bianchi Debra and Lucius Jennifer
Bought by
Boux Sophia and Boux Nicholas George
Current Estimated Value
Home Financials for this Owner
Home Financials are based on the most recent Mortgage that was taken out on this home.
Original Mortgage
$338,049
Interest Rate
3.1%
Mortgage Type
VA
Purchase Details
Closed on
Feb 4, 2021
Sold by
Gonzalez Donna and Estate Of Patricia J Hayes
Bought by
Bianchi Debra and Lucius Jennifer
Home Financials for this Owner
Home Financials are based on the most recent Mortgage that was taken out on this home.
Original Mortgage
$338,049
Interest Rate
3.1%
Mortgage Type
VA
Purchase Details
Closed on
Aug 15, 2007
Sold by
Drh Cambridge Homes Inc
Bought by
Hayes Dennis G and Hayes Patricia J
Home Financials for this Owner
Home Financials are based on the most recent Mortgage that was taken out on this home.
Original Mortgage
$294,150
Interest Rate
6.79%
Mortgage Type
Purchase Money Mortgage
Create a Home Valuation Report for This Property
The Home Valuation Report is an in-depth analysis detailing your home's value as well as a comparison with similar homes in the area
Home Values in the Area
Average Home Value in this Area
Purchase History
| Date | Buyer | Sale Price | Title Company |
|---|---|---|---|
| Boux Sophia | $340,000 | Heritage Title Co | |
| Bianchi Debra | -- | None Available | |
| Hayes Dennis G | $367,690 | Fatic |
Source: Public Records
Mortgage History
| Date | Status | Borrower | Loan Amount |
|---|---|---|---|
| Previous Owner | Boux Sophia | $338,049 | |
| Previous Owner | Hayes Dennis G | $294,150 |
Source: Public Records
Tax History
| Year | Tax Paid | Tax Assessment Tax Assessment Total Assessment is a certain percentage of the fair market value that is determined by local assessors to be the total taxable value of land and additions on the property. | Land | Improvement |
|---|---|---|---|---|
| 2024 | $9,079 | $135,841 | $11,644 | $124,197 |
| 2023 | $8,827 | $122,028 | $10,460 | $111,568 |
| 2022 | $8,412 | $111,117 | $9,525 | $101,592 |
| 2021 | $7,745 | $104,650 | $8,971 | $95,679 |
| 2020 | $7,604 | $101,859 | $8,732 | $93,127 |
| 2019 | $7,415 | $99,258 | $8,509 | $90,749 |
| 2018 | $7,157 | $95,096 | $9,575 | $85,521 |
| 2017 | $6,987 | $89,621 | $9,024 | $80,597 |
| 2016 | $7,027 | $85,208 | $8,580 | $76,628 |
| 2013 | -- | $78,326 | $16,454 | $61,872 |
Source: Public Records
Map
Nearby Homes
- 9711 Aberdeen Ln
- 5701 Wildspring Dr
- 9186 Ritz Ct
- 9111 Marks Ct
- 10003 Cummings St
- 8946 Disbrow St Unit 8946
- 12316 Bartelt Ln
- 9888 Wakefield Ln Unit 11
- 12309 Garlieb Dr
- 9204 Haligus Rd
- 11914 Hollister Ct
- 12321 Tinsley St
- 12381 Tinsley St
- 12334 Tinsley St
- 10184 Leopold Ln
- 10610 Mathew St
- 12185 Dodwell St
- 12177 Dodwell St
- 12183 Dodwell St
- 12173 Dodwell St
- 9683 Dover Ct
- 9733 Rainsford Dr
- 9673 Dover Ct
- 9688 Rainsford Dr
- 11410 Kingsbury Rd
- 9678 Rainsford Dr
- 9633 Dover Ct
- 11420 Kingsbury Rd
- 9663 Dover Ct
- 11349 Caldwell Dr
- 9643 Dover Ct
- 9668 Rainsford Dr
- 9653 Dover Ct
- 11430 Kingsbury Rd
- 11342 Kingsbury Ct
- 9658 Rainsford Dr
- 11339 Caldwell Dr
- 9750 Newton Rd
- 9740 Newton Rd
- 11332 Kingsbury Ct
Your Personal Tour Guide
Ask me questions while you tour the home.