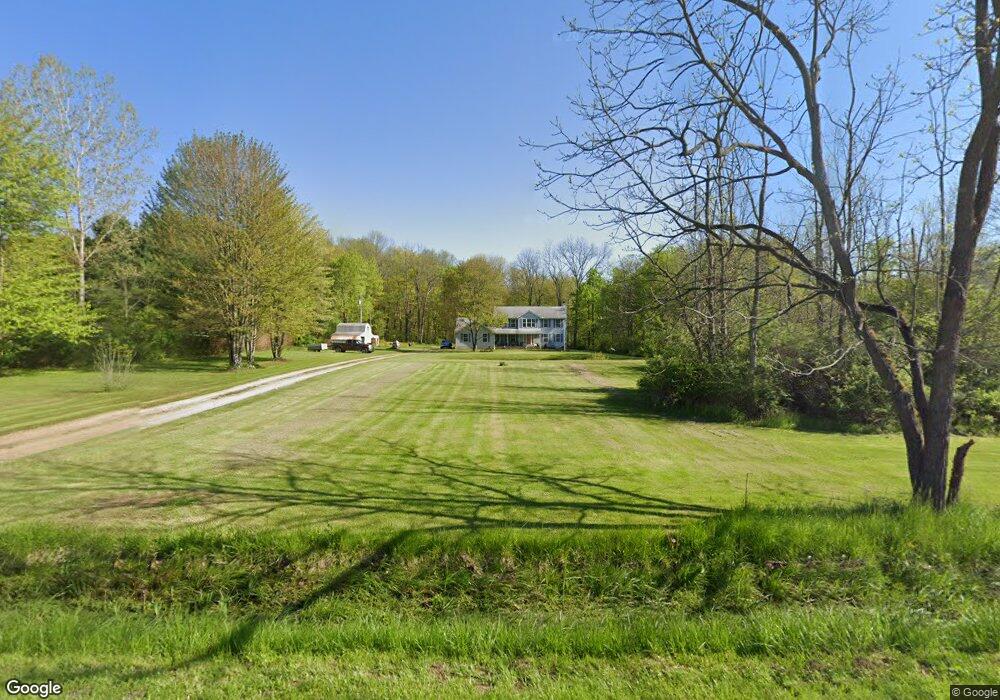
9693 Knowlton Rd Garrettsville, OH 44231
Estimated Value: $411,000 - $494,000
3
Beds
3
Baths
2,474
Sq Ft
$179/Sq Ft
Est. Value
About This Home
This home is located at 9693 Knowlton Rd, Garrettsville, OH 44231 and is currently estimated at $443,667, approximately $179 per square foot. 9693 Knowlton Rd is a home located in Portage County with nearby schools including James A. Garfield Elementary School, James A. Garfield Middle School, and James A. Garfield High School.
Ownership History
Date
Name
Owned For
Owner Type
Purchase Details
Closed on
Nov 19, 2013
Sold by
Kressierer Joan M
Bought by
Kressierer Matthew F
Current Estimated Value
Purchase Details
Closed on
Oct 24, 2000
Sold by
Smith Kenneth C and Smith Karen A
Bought by
Goodwin Kevin S and Goodwin Diane R
Home Financials for this Owner
Home Financials are based on the most recent Mortgage that was taken out on this home.
Original Mortgage
$28,500
Interest Rate
7.91%
Purchase Details
Closed on
Sep 25, 2000
Sold by
Smith Kenneth C and Smith Karen A
Bought by
Kressierer Matthew F and Kressierer Joan M
Home Financials for this Owner
Home Financials are based on the most recent Mortgage that was taken out on this home.
Original Mortgage
$28,500
Interest Rate
7.91%
Create a Home Valuation Report for This Property
The Home Valuation Report is an in-depth analysis detailing your home's value as well as a comparison with similar homes in the area
Home Values in the Area
Average Home Value in this Area
Purchase History
| Date | Buyer | Sale Price | Title Company |
|---|---|---|---|
| Kressierer Matthew F | -- | Attorney | |
| Goodwin Kevin S | $28,500 | Ravenna Title Agency Inc | |
| Kressierer Matthew F | $35,500 | Approved Statewide Title Age | |
| Smith Kenneth C | -- | Approved Statewide Title Age |
Source: Public Records
Mortgage History
| Date | Status | Borrower | Loan Amount |
|---|---|---|---|
| Closed | Goodwin Kevin S | $28,500 | |
| Closed | Kressierer Matthew F | $127,500 |
Source: Public Records
Tax History Compared to Growth
Tax History
| Year | Tax Paid | Tax Assessment Tax Assessment Total Assessment is a certain percentage of the fair market value that is determined by local assessors to be the total taxable value of land and additions on the property. | Land | Improvement |
|---|---|---|---|---|
| 2024 | $4,111 | $115,290 | $20,370 | $94,920 |
| 2023 | $3,648 | $89,540 | $14,670 | $74,870 |
| 2022 | $3,652 | $89,540 | $14,670 | $74,870 |
| 2021 | $3,535 | $89,540 | $14,670 | $74,870 |
| 2020 | $3,246 | $80,330 | $14,670 | $65,660 |
| 2019 | $3,253 | $80,330 | $14,670 | $65,660 |
| 2018 | $3,268 | $69,620 | $12,430 | $57,190 |
| 2017 | $3,268 | $69,620 | $12,430 | $57,190 |
| 2016 | $3,165 | $69,620 | $12,430 | $57,190 |
| 2015 | $3,182 | $69,620 | $12,430 | $57,190 |
| 2014 | $3,400 | $69,620 | $12,430 | $57,190 |
| 2013 | $3,371 | $69,620 | $12,430 | $57,190 |
Source: Public Records
Map
Nearby Homes
- 11316 Nicholson Rd
- V/L 4 & 5 Center Rd
- 11081 Brosius Rd
- 8540 Riverview Dr
- 8127 Garfield Dr
- 8388 Garfield Dr
- 10376 Brosius Rd Unit 25
- 0 Parkman Unit 5040066
- 5429 U S 422
- 11769 Mills Rd Unit 1
- 12525 Brosius Rd
- 8210 Maple Ave
- 12157 State Route 88
- 12977 Main Market Rd
- V/L Parkman Rd
- 8218 Windham St
- VL Ohio 82
- 7972 State Route 305
- 12707 Brosius Rd
- 10168 Stanley Rd
- 9663 Knowlton Rd
- 9625 Knowlton Rd
- 9676 Knowlton Rd
- 11385 Bloom Rd
- 11399 Bloom Rd
- 9636 Knowlton Rd
- 11407 Bloom Rd
- 11411 Bloom Rd
- 9595 Knowlton Rd
- 9588 Knowlton Rd
- 11343 Bloom Rd
- 11417 Bloom Rd
- 11374 Bloom Rd
- 9566 Knowlton Rd
- 11305 Bloom Rd
- 11438 Bloom Rd
- 11394 Bloom Rd
- 11447 Bloom Rd
- 9546 Knowlton Rd
- 11293 Bloom Rd