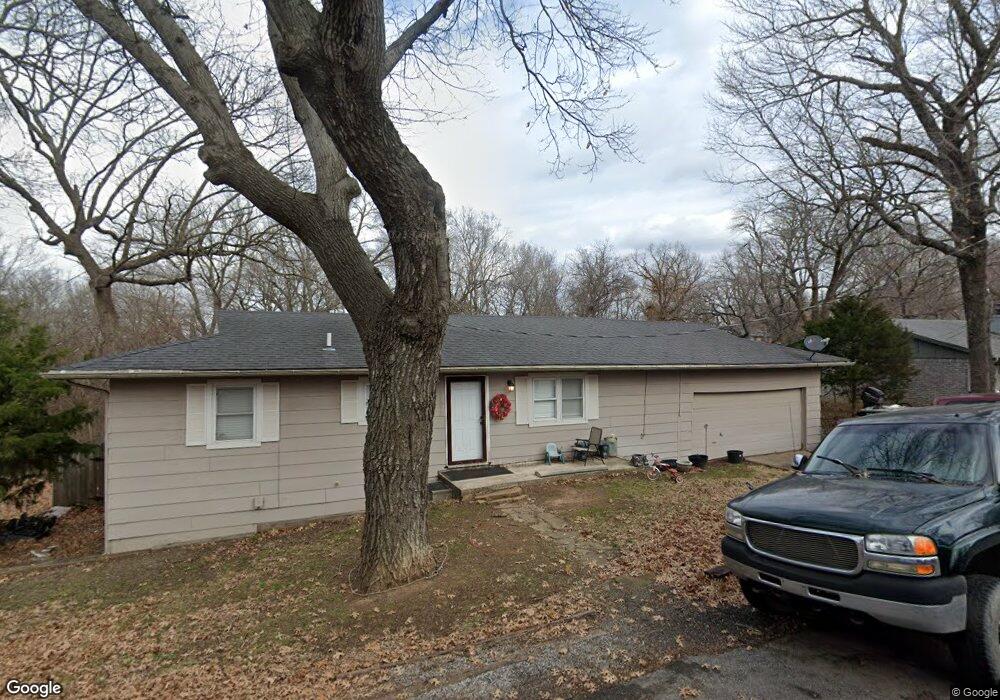
9697 E Walnut Rd Claremore, OK 74017
Estimated Value: $135,037 - $206,000
2
Beds
1
Bath
1,056
Sq Ft
$155/Sq Ft
Est. Value
About This Home
This home is located at 9697 E Walnut Rd, Claremore, OK 74017 and is currently estimated at $164,009, approximately $155 per square foot. 9697 E Walnut Rd is a home located in Rogers County with nearby schools including Sequoyah Elementary School and Sequoyah High School.
Ownership History
Date
Name
Owned For
Owner Type
Purchase Details
Closed on
Dec 12, 2024
Sold by
Jackson Miranda
Bought by
Nutter Casey
Current Estimated Value
Purchase Details
Closed on
Jul 22, 2009
Sold by
Stroble John A and Stroble Yolanda B
Bought by
Jackson Miranda R
Home Financials for this Owner
Home Financials are based on the most recent Mortgage that was taken out on this home.
Original Mortgage
$15,000
Interest Rate
5.44%
Mortgage Type
Stand Alone Second
Purchase Details
Closed on
Dec 20, 2005
Sold by
Mortgage Clearing Corp
Bought by
Stroble John A and Stroble Yolanda B
Purchase Details
Closed on
Oct 6, 2005
Sold by
Gresham Tim and Estate Of Dustin D Webster
Bought by
Mortgage Clearing Corp
Purchase Details
Closed on
Mar 1, 2000
Sold by
Briggs Melvin W
Purchase Details
Closed on
Apr 24, 1997
Sold by
Collins Clarence E
Create a Home Valuation Report for This Property
The Home Valuation Report is an in-depth analysis detailing your home's value as well as a comparison with similar homes in the area
Purchase History
| Date | Buyer | Sale Price | Title Company |
|---|---|---|---|
| Nutter Casey | -- | None Listed On Document | |
| Jackson Miranda R | $67,000 | Guaranty Abstract Co | |
| Stroble John A | $39,500 | Land Title Closing Services | |
| Mortgage Clearing Corp | $60,000 | None Available | |
| -- | $59,000 | -- | |
| -- | $48,000 | -- |
Source: Public Records
Mortgage History
| Date | Status | Borrower | Loan Amount |
|---|---|---|---|
| Previous Owner | Jackson Miranda R | $15,000 | |
| Previous Owner | Jackson Miranda R | $56,560 |
Source: Public Records
Tax History
| Year | Tax Paid | Tax Assessment Tax Assessment Total Assessment is a certain percentage of the fair market value that is determined by local assessors to be the total taxable value of land and additions on the property. | Land | Improvement |
|---|---|---|---|---|
| 2025 | $957 | $9,350 | $1,992 | $7,358 |
| 2024 | $915 | $8,904 | $1,897 | $7,007 |
| 2023 | $915 | $8,481 | $1,650 | $6,831 |
| 2022 | $894 | $8,480 | $1,650 | $6,830 |
| 2021 | $923 | $9,069 | $1,650 | $7,419 |
| 2020 | $949 | $9,028 | $1,650 | $7,378 |
| 2019 | $891 | $8,602 | $1,650 | $6,952 |
| 2018 | $938 | $8,952 | $1,650 | $7,302 |
| 2017 | $909 | $8,881 | $1,650 | $7,231 |
| 2016 | $891 | $8,659 | $1,650 | $7,009 |
| 2015 | $865 | $8,318 | $1,650 | $6,668 |
| 2014 | $824 | $7,922 | $1,650 | $6,272 |
Source: Public Records
Map
Nearby Homes
- 11802 S Hickory St
- 13266 S Spruce Ln
- 13196 S Walnut Rd
- 13122 S Redbud St
- 9885 E Mesa Dr
- 13525 S Grande Pointe Pkwy
- 0 E 420 Rd Unit 2604502
- 0 E 420 Rd Unit 2604695
- 0004 S 4110 Rd
- 0003 S 4110 Rd
- 0005 S 4110 Rd
- 11252 S 4110 Rd
- 11225 S Oologah Cir
- 15750 S Old Highway 88
- 000 HWY 88
- 7 E 420
- 9462 E Yorkshire Ave
- 0 S 4130 Rd
- 102 Saddle Ln
- 7425 E Oologah Place
- 11962 S Hickory St
- 11852 S Hickory St
- 9701 E Walnut Rd
- 9701 Walnut St
- 9675 E Walnut Rd
- 5909 E Willow St
- 5913 E Willow St
- 5800 E Willow St
- 13122 S Hickory St
- 9835 E Willow St
- 9823 E Willow St
- 13111 S Hickory St
- 13111 S Walnut Rd
- 9847 E Willow St
- 13144 S Hickory St
- 9851 E Willow St
- 13133 S Walnut Rd
- 13160 S Hickory St
- 9862 E Willow St
- 13155 S Hickory St
Your Personal Tour Guide
Ask me questions while you tour the home.