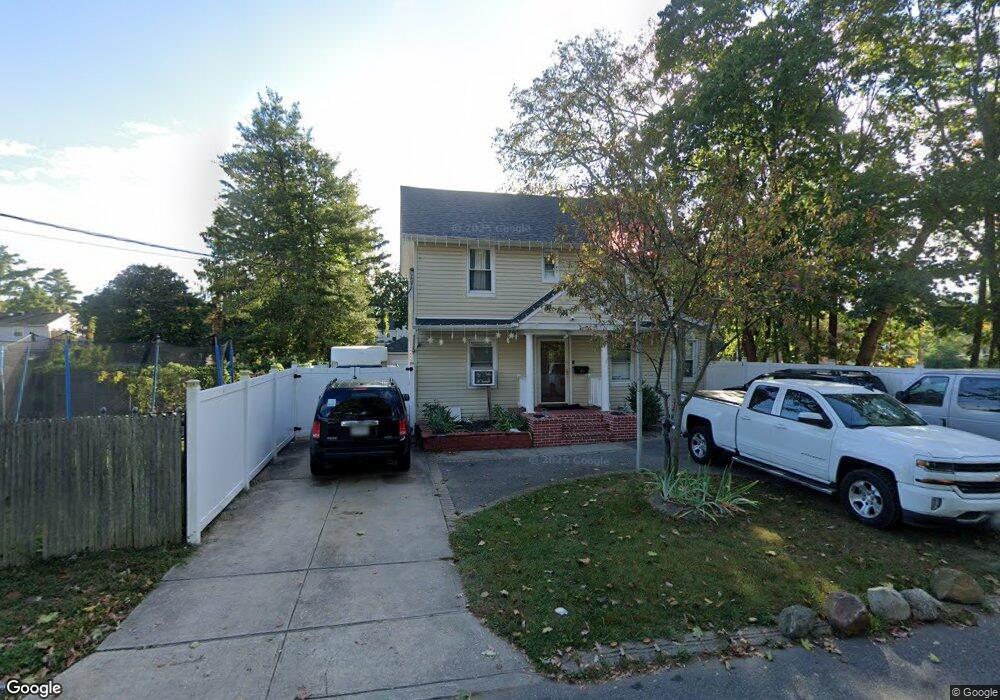
97 4th St Brentwood, NY 11717
Estimated Value: $625,462 - $682,000
4
Beds
3
Baths
--
Sq Ft
7,405
Sq Ft Lot
About This Home
This home is located at 97 4th St, Brentwood, NY 11717 and is currently estimated at $651,366. 97 4th St is a home located in Suffolk County with nearby schools including MDQ Academy.
Ownership History
Date
Name
Owned For
Owner Type
Purchase Details
Closed on
Apr 19, 2019
Sold by
Guardian Housing Dev Llc
Bought by
Reyes-Escobar Jose A
Current Estimated Value
Home Financials for this Owner
Home Financials are based on the most recent Mortgage that was taken out on this home.
Original Mortgage
$342,618
Outstanding Balance
$298,053
Interest Rate
4.2%
Mortgage Type
New Conventional
Estimated Equity
$353,313
Purchase Details
Closed on
Apr 27, 2005
Sold by
Ayala Rafael
Bought by
Fuentes Ana
Purchase Details
Closed on
Apr 19, 1996
Sold by
Millen Inc
Bought by
Ayala Rafael and Ayala Dora
Purchase Details
Closed on
Jun 20, 1995
Sold by
Bht Ltd Lp
Bought by
Millen Inc
Create a Home Valuation Report for This Property
The Home Valuation Report is an in-depth analysis detailing your home's value as well as a comparison with similar homes in the area
Home Values in the Area
Average Home Value in this Area
Purchase History
| Date | Buyer | Sale Price | Title Company |
|---|---|---|---|
| Reyes-Escobar Jose A | $360,650 | -- | |
| Fuentes Ana | $327,000 | Andrea Mottola | |
| Ayala Rafael | $107,000 | Boundary Title Services Inc | |
| Millen Inc | $48,000 | First American Title Ins Co |
Source: Public Records
Mortgage History
| Date | Status | Borrower | Loan Amount |
|---|---|---|---|
| Open | Reyes-Escobar Jose A | $342,618 |
Source: Public Records
Tax History Compared to Growth
Tax History
| Year | Tax Paid | Tax Assessment Tax Assessment Total Assessment is a certain percentage of the fair market value that is determined by local assessors to be the total taxable value of land and additions on the property. | Land | Improvement |
|---|---|---|---|---|
| 2024 | $8,334 | $33,100 | $6,600 | $26,500 |
| 2023 | $8,334 | $33,100 | $6,600 | $26,500 |
| 2022 | $6,097 | $33,100 | $6,600 | $26,500 |
| 2021 | $6,097 | $33,100 | $6,600 | $26,500 |
| 2020 | $7,093 | $33,100 | $6,600 | $26,500 |
| 2019 | $7,093 | $0 | $0 | $0 |
| 2018 | -- | $30,000 | $6,600 | $23,400 |
| 2017 | $5,898 | $30,000 | $6,600 | $23,400 |
| 2016 | $5,834 | $30,000 | $6,600 | $23,400 |
| 2015 | -- | $30,000 | $6,600 | $23,400 |
| 2014 | -- | $30,000 | $6,600 | $23,400 |
Source: Public Records
Map
Nearby Homes