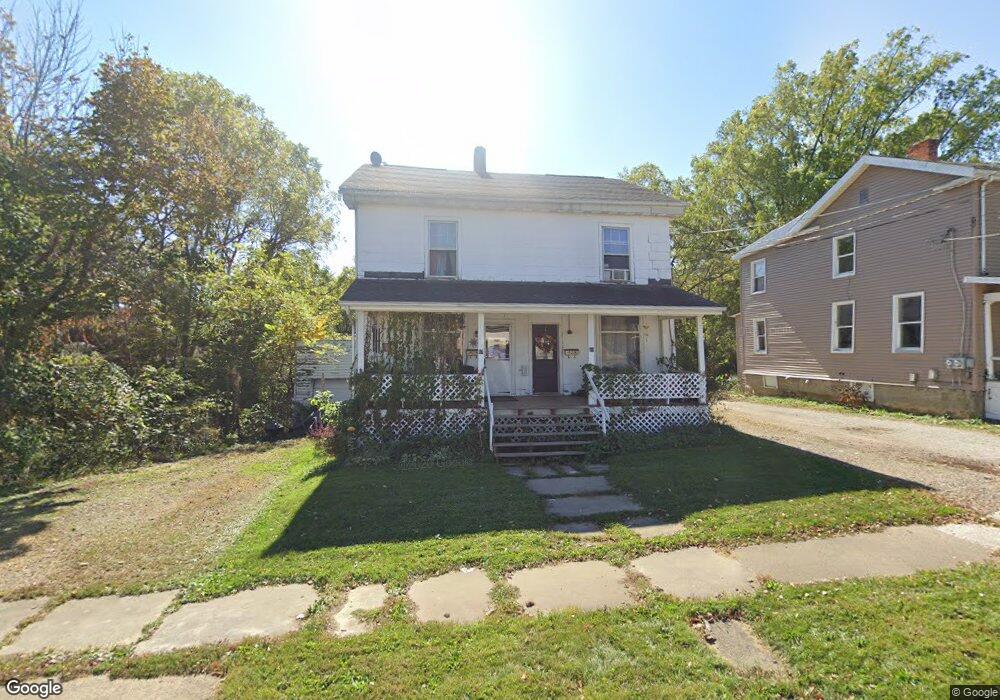
97-99 W High St Mount Gilead, OH 43338
Estimated Value: $154,000 - $186,000
5
Beds
2
Baths
2,320
Sq Ft
$73/Sq Ft
Est. Value
About This Home
This home is located at 97-99 W High St, Mount Gilead, OH 43338 and is currently estimated at $170,388, approximately $73 per square foot. 97-99 W High St is a home located in Morrow County with nearby schools including Park Avenue Elementary School, Mt Gilead Middle School, and Mt Gilead High School.
Ownership History
Date
Name
Owned For
Owner Type
Purchase Details
Closed on
Jan 15, 2014
Bought by
Brattin Ratree
Current Estimated Value
Home Financials for this Owner
Home Financials are based on the most recent Mortgage that was taken out on this home.
Original Mortgage
$40,000
Outstanding Balance
$30,325
Interest Rate
4.5%
Mortgage Type
Future Advance Clause Open End Mortgage
Estimated Equity
$140,063
Purchase Details
Closed on
May 5, 2003
Sold by
Salyer Allie E and Salyer Cynthia
Bought by
Small Town Rentals Llc
Purchase Details
Closed on
Mar 28, 2003
Bought by
Salyer Allie E and Cynthia Salyer
Purchase Details
Closed on
Apr 15, 2002
Sold by
Salyer Ollie and Salyer Cynthia
Bought by
Small Town Rentals Llc
Purchase Details
Closed on
May 30, 2000
Bought by
Salyer Ollie and Salyer Cynthia
Purchase Details
Closed on
Dec 3, 1999
Sold by
Wood Thomas R And
Bought by
T. C. Wood Investments
Purchase Details
Closed on
Jan 11, 1996
Bought by
Wood Thomas R And
Create a Home Valuation Report for This Property
The Home Valuation Report is an in-depth analysis detailing your home's value as well as a comparison with similar homes in the area
Home Values in the Area
Average Home Value in this Area
Purchase History
| Date | Buyer | Sale Price | Title Company |
|---|---|---|---|
| Brattin Ratree | -- | -- | |
| Small Town Rentals Llc | -- | -- | |
| Salyer Allie E | -- | -- | |
| Small Town Rentals Llc | -- | -- | |
| Salyer Ollie | $79,900 | -- | |
| T. C. Wood Investments | -- | -- | |
| Wood Thomas R And | $44,000 | -- |
Source: Public Records
Mortgage History
| Date | Status | Borrower | Loan Amount |
|---|---|---|---|
| Open | Brattin Ratree | $40,000 |
Source: Public Records
Tax History Compared to Growth
Tax History
| Year | Tax Paid | Tax Assessment Tax Assessment Total Assessment is a certain percentage of the fair market value that is determined by local assessors to be the total taxable value of land and additions on the property. | Land | Improvement |
|---|---|---|---|---|
| 2024 | $1,631 | $36,620 | $7,670 | $28,950 |
| 2023 | $1,631 | $36,620 | $7,670 | $28,950 |
| 2022 | $1,257 | $25,100 | $6,620 | $18,480 |
| 2021 | $1,197 | $25,100 | $6,620 | $18,480 |
| 2020 | $1,198 | $25,100 | $6,620 | $18,480 |
| 2019 | $1,058 | $21,810 | $5,740 | $16,070 |
| 2018 | $1,059 | $21,810 | $5,740 | $16,070 |
| 2017 | $1,031 | $21,810 | $5,740 | $16,070 |
| 2016 | $1,044 | $21,950 | $6,200 | $15,750 |
| 2015 | $978 | $21,950 | $6,200 | $15,750 |
| 2014 | $992 | $21,950 | $6,200 | $15,750 |
| 2013 | $1,044 | $24,400 | $6,900 | $17,500 |
Source: Public Records
Map
Nearby Homes
- 69 N Cherry St
- 186 Iberia St
- 236 W High St
- 0 Iberia St
- 250 S Main St
- 264 W High St
- 0 Tamarack Unit 223034150
- 362 W High St
- 473 N Delaware St
- 0 Lee St
- 5098 County Road 237
- 574 Buckeye Ln
- 669 Baker St
- 730 W Marion St
- 5720 County Road 30
- 5171 U S 42
- 150 E High St
- 135 High St
- 0 Township Road 110 Unit 6131011
- 5221 County Road 9