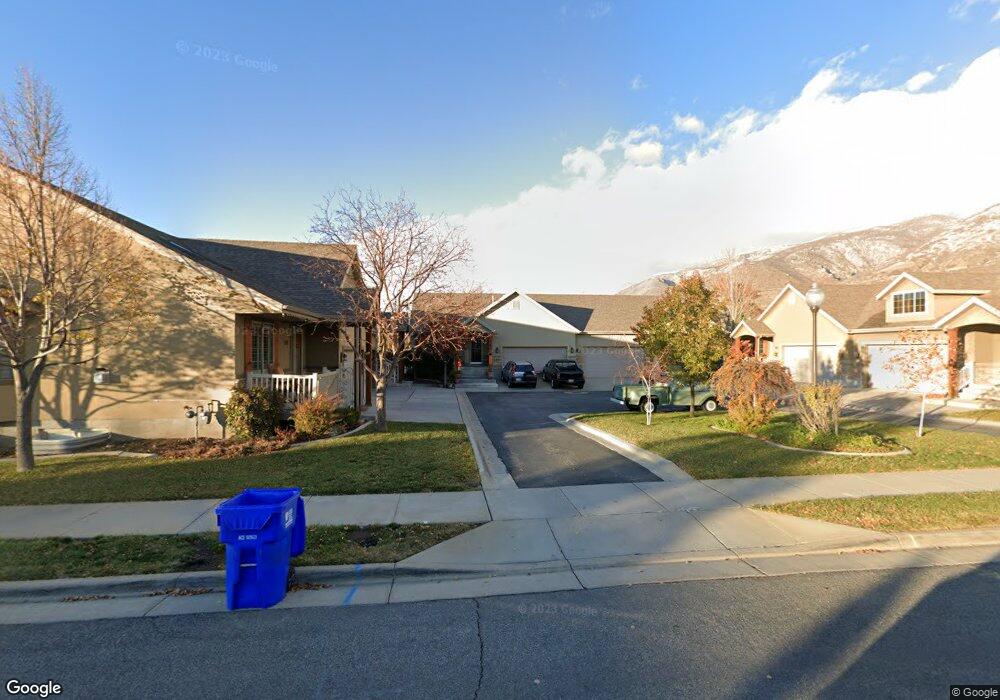
97 Bamberger Way Centerville, UT 84014
Estimated Value: $410,000 - $516,000
3
Beds
3
Baths
1,272
Sq Ft
$376/Sq Ft
Est. Value
About This Home
This home is located at 97 Bamberger Way, Centerville, UT 84014 and is currently estimated at $478,718, approximately $376 per square foot. 97 Bamberger Way is a home located in Davis County with nearby schools including J A Taylor Elementary School, Centerville Jr High, and Viewmont High School.
Ownership History
Date
Name
Owned For
Owner Type
Purchase Details
Closed on
Sep 24, 2018
Sold by
Sorensen Roger G and Sorensen Karla K
Bought by
Sorensen Roger G and Sorensen Karla K
Current Estimated Value
Purchase Details
Closed on
Jul 26, 2007
Sold by
Walton Lane Llc
Bought by
Sorensen Roger G and Sorensen Karla K
Home Financials for this Owner
Home Financials are based on the most recent Mortgage that was taken out on this home.
Original Mortgage
$270,000
Outstanding Balance
$190,935
Interest Rate
9.2%
Mortgage Type
Balloon
Estimated Equity
$287,783
Create a Home Valuation Report for This Property
The Home Valuation Report is an in-depth analysis detailing your home's value as well as a comparison with similar homes in the area
Purchase History
| Date | Buyer | Sale Price | Title Company |
|---|---|---|---|
| Sorensen Roger G | -- | None Available | |
| Sorensen Roger G | -- | Aspen Title Insurance Agency |
Source: Public Records
Mortgage History
| Date | Status | Borrower | Loan Amount |
|---|---|---|---|
| Open | Sorensen Roger G | $270,000 |
Source: Public Records
Tax History
| Year | Tax Paid | Tax Assessment Tax Assessment Total Assessment is a certain percentage of the fair market value that is determined by local assessors to be the total taxable value of land and additions on the property. | Land | Improvement |
|---|---|---|---|---|
| 2025 | $3,065 | $293,150 | $72,050 | $221,100 |
| 2024 | $3,092 | $300,850 | $55,000 | $245,850 |
| 2023 | $3,134 | $551,000 | $98,000 | $453,000 |
| 2022 | $3,216 | $311,300 | $52,800 | $258,500 |
| 2021 | $2,656 | $400,500 | $69,000 | $331,500 |
| 2020 | $2,640 | $398,000 | $64,500 | $333,500 |
| 2019 | $2,547 | $375,000 | $62,000 | $313,000 |
| 2018 | $2,489 | $346,000 | $58,000 | $288,000 |
| 2016 | $2,133 | $163,515 | $20,350 | $143,165 |
| 2015 | $2,013 | $153,505 | $20,350 | $133,155 |
| 2014 | $2,119 | $156,734 | $18,333 | $138,401 |
| 2013 | -- | $142,959 | $19,250 | $123,709 |
Source: Public Records
Map
Nearby Homes
- 88 W 50 S Unit A4
- 88 W 50 S Unit C-3
- 88 W 50 S Unit B5
- 56 W 200 N
- 330 W Paradiso Ln
- 147 N 360 W Unit 21
- 324 S 600 W
- 360 E Center St
- 328 E 1100 S
- 287 S 680 W Unit 9
- 252 N 400 E
- 345 E 600 S
- 380 E 400 N
- 282 W 605 N Unit I
- 204 Lyman Ln
- 295 E 500 N
- 83 W 850 S
- 281 W 650 N Unit B
- 303 W 650 N Unit I
- 495 E 475 S
Your Personal Tour Guide
Ask me questions while you tour the home.