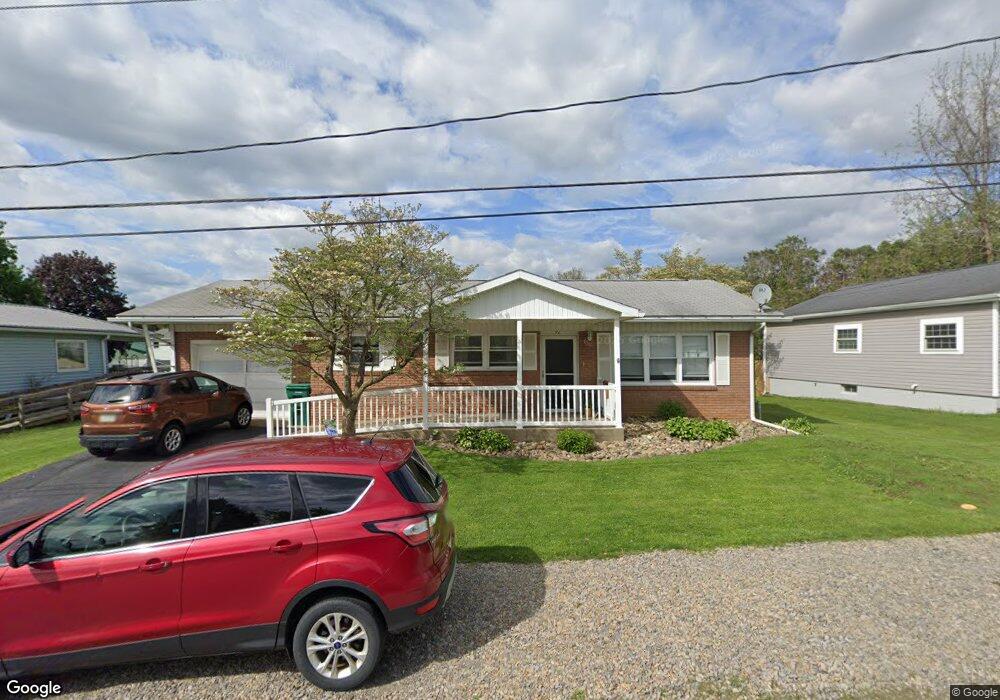
97 Bryant St Homer City, PA 15748
Estimated Value: $133,000 - $154,000
2
Beds
1
Bath
1,026
Sq Ft
$139/Sq Ft
Est. Value
About This Home
This home is located at 97 Bryant St, Homer City, PA 15748 and is currently estimated at $142,577, approximately $138 per square foot. 97 Bryant St is a home located in Indiana County with nearby schools including Homer-Center Elementary School and Homer-Center Junior/Senior High School.
Ownership History
Date
Name
Owned For
Owner Type
Purchase Details
Closed on
Sep 24, 2024
Sold by
Tedeski John M
Bought by
Tedeski John M and Tedeski Rhonda
Current Estimated Value
Home Financials for this Owner
Home Financials are based on the most recent Mortgage that was taken out on this home.
Original Mortgage
$101,750
Outstanding Balance
$100,666
Interest Rate
6.75%
Mortgage Type
FHA
Estimated Equity
$41,911
Purchase Details
Closed on
Aug 18, 2022
Sold by
Tedeski John M
Bought by
Tedeski John M
Create a Home Valuation Report for This Property
The Home Valuation Report is an in-depth analysis detailing your home's value as well as a comparison with similar homes in the area
Home Values in the Area
Average Home Value in this Area
Purchase History
| Date | Buyer | Sale Price | Title Company |
|---|---|---|---|
| Tedeski John M | -- | First Source Title | |
| Tedeski John M | -- | None Listed On Document |
Source: Public Records
Mortgage History
| Date | Status | Borrower | Loan Amount |
|---|---|---|---|
| Open | Tedeski John M | $101,750 |
Source: Public Records
Tax History Compared to Growth
Tax History
| Year | Tax Paid | Tax Assessment Tax Assessment Total Assessment is a certain percentage of the fair market value that is determined by local assessors to be the total taxable value of land and additions on the property. | Land | Improvement |
|---|---|---|---|---|
| 2025 | $2,278 | $90,900 | $17,700 | $73,200 |
| 2024 | $2,242 | $90,900 | $17,700 | $73,200 |
| 2023 | $2,108 | $90,900 | $17,700 | $73,200 |
| 2022 | $2,086 | $90,900 | $17,700 | $73,200 |
| 2021 | $2,086 | $90,900 | $17,700 | $73,200 |
| 2020 | $2,044 | $90,900 | $17,700 | $73,200 |
| 2018 | $2,019 | $90,900 | $17,700 | $73,200 |
| 2017 | $1,656 | $90,900 | $17,700 | $73,200 |
| 2016 | -- | $90,900 | $17,700 | $73,200 |
| 2015 | -- | $16,040 | $1,280 | $14,760 |
| 2014 | -- | $16,040 | $1,280 | $14,760 |
Source: Public Records
Map
Nearby Homes