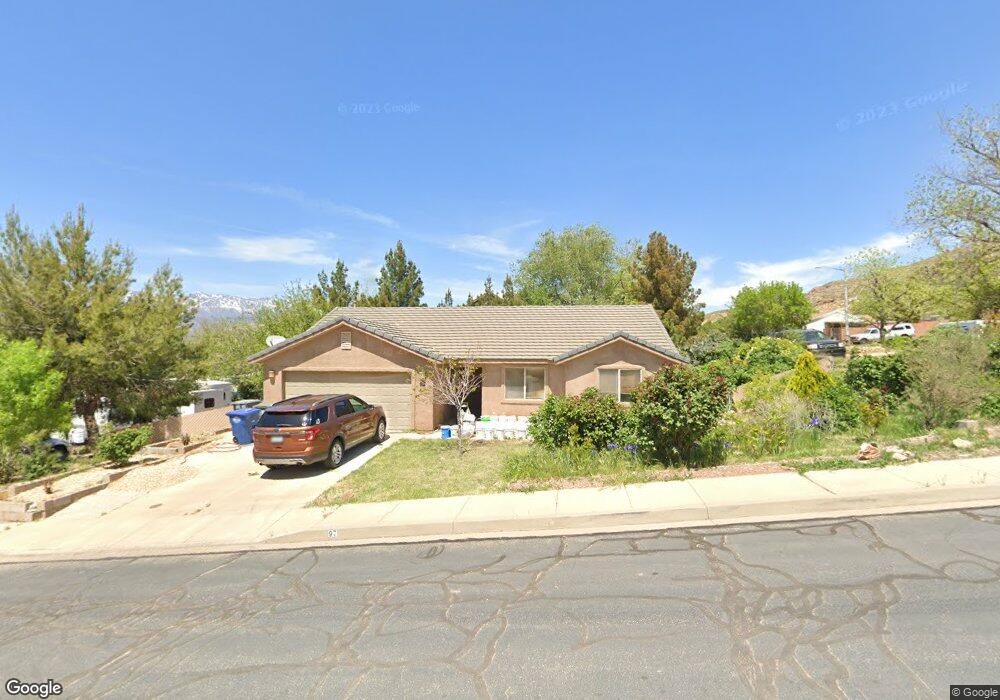
97 E 70 N La Verkin, UT 84745
Estimated Value: $383,000 - $446,000
3
Beds
2
Baths
1,321
Sq Ft
$311/Sq Ft
Est. Value
About This Home
This home is located at 97 E 70 N, La Verkin, UT 84745 and is currently estimated at $410,928, approximately $311 per square foot. 97 E 70 N is a home located in Washington County with nearby schools including La Verkin Elementary School, Hurricane Middle School, and Hurricane High School.
Ownership History
Date
Name
Owned For
Owner Type
Purchase Details
Closed on
Jan 17, 2007
Sold by
Thompson Alfer and Thompson Susan Camille
Bought by
Myers Luellen and Myers Michele R
Current Estimated Value
Home Financials for this Owner
Home Financials are based on the most recent Mortgage that was taken out on this home.
Original Mortgage
$225,500
Outstanding Balance
$133,932
Interest Rate
6.1%
Mortgage Type
Unknown
Estimated Equity
$276,996
Purchase Details
Closed on
Jul 29, 2005
Sold by
Nielson Scott and Nielson Kristin
Bought by
Thompson Alfer and Thompson Susan Camille
Home Financials for this Owner
Home Financials are based on the most recent Mortgage that was taken out on this home.
Original Mortgage
$155,000
Interest Rate
5.61%
Mortgage Type
Unknown
Purchase Details
Closed on
Mar 31, 2005
Sold by
Cottam Dareb K and Cottam Darren K
Bought by
Cottam Daren K and Cottam Darren K
Create a Home Valuation Report for This Property
The Home Valuation Report is an in-depth analysis detailing your home's value as well as a comparison with similar homes in the area
Home Values in the Area
Average Home Value in this Area
Purchase History
| Date | Buyer | Sale Price | Title Company |
|---|---|---|---|
| Myers Luellen | -- | Provo Land Title St George B | |
| Thompson Alfer | -- | First Title Of Utah | |
| Cottam Daren K | -- | Dixie Title Co |
Source: Public Records
Mortgage History
| Date | Status | Borrower | Loan Amount |
|---|---|---|---|
| Open | Myers Luellen | $225,500 | |
| Previous Owner | Thompson Alfer | $155,000 |
Source: Public Records
Tax History
| Year | Tax Paid | Tax Assessment Tax Assessment Total Assessment is a certain percentage of the fair market value that is determined by local assessors to be the total taxable value of land and additions on the property. | Land | Improvement |
|---|---|---|---|---|
| 2025 | $1,586 | $209,385 | $59,400 | $149,985 |
| 2023 | $1,512 | $200,420 | $59,400 | $141,020 |
| 2022 | $1,581 | $197,285 | $39,600 | $157,685 |
| 2021 | $1,428 | $262,300 | $54,000 | $208,300 |
| 2020 | $1,292 | $222,000 | $54,000 | $168,000 |
| 2019 | $1,188 | $195,700 | $35,000 | $160,700 |
| 2018 | $1,079 | $89,925 | $0 | $0 |
| 2017 | $1,075 | $87,175 | $0 | $0 |
| 2016 | $1,025 | $79,750 | $0 | $0 |
| 2015 | $961 | $71,940 | $0 | $0 |
| 2014 | $875 | $64,570 | $0 | $0 |
Source: Public Records
Map
Nearby Homes
- 728 N 15 W
- 0 Lot #1 Valle Vista Unit 25-262463
- 0 Lot #4 Valle Vista Unit 25-262467
- 0 Lot #2 Valle Vista Unit 25-262464
- 0 Vista Unit 25-262466
- 161 E 130 N
- 65 S Main St
- 25 E 200 N
- 235 N 200 E
- 235 N 200 E Unit 55
- 80 W Center St Unit 13
- 200 N State St
- 0 La Verkin Lot Unit 24-252790
- 54 E 200 S
- 233 N State St
- 353 N 200 E Unit 40
- 353 N 200 E
- 140 S 100 W
- 57 W 180 S
- 385 N 100 E
Your Personal Tour Guide
Ask me questions while you tour the home.