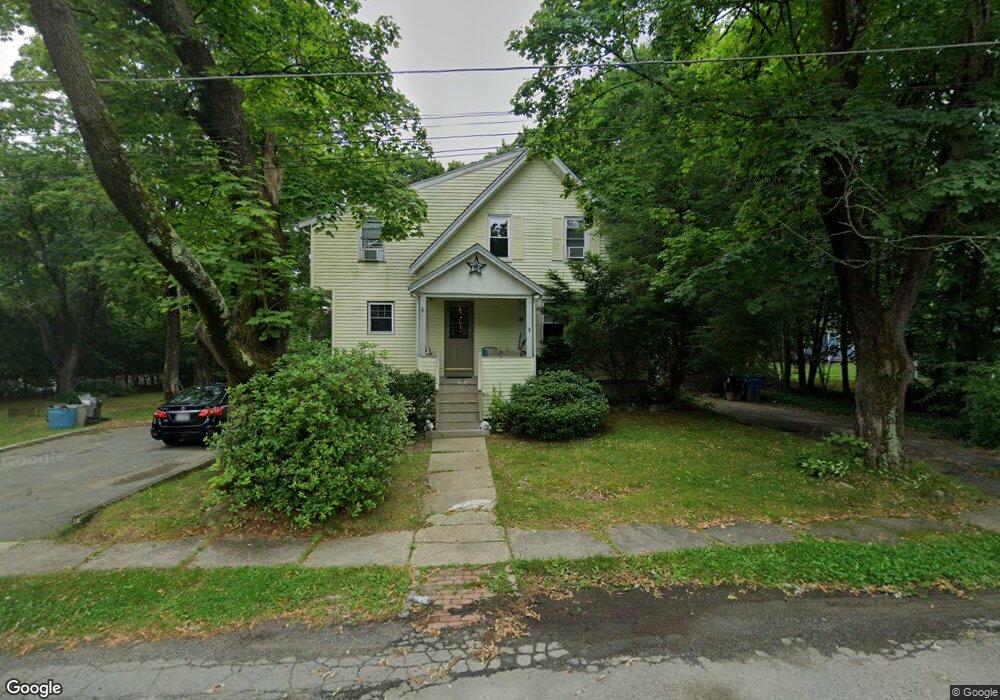
97 Ellis Ave Whitman, MA 02382
Estimated Value: $609,964 - $742,000
5
Beds
3
Baths
2,327
Sq Ft
$288/Sq Ft
Est. Value
About This Home
This home is located at 97 Ellis Ave, Whitman, MA 02382 and is currently estimated at $671,241, approximately $288 per square foot. 97 Ellis Ave is a home located in Plymouth County with nearby schools including St Bridget School.
Ownership History
Date
Name
Owned For
Owner Type
Purchase Details
Closed on
Jun 30, 2004
Sold by
Race Kathryn M and Race Donald L
Bought by
Race Kathryn M and Race Donald L
Current Estimated Value
Purchase Details
Closed on
Oct 30, 1995
Sold by
Halterman Scott A and Halterman Karen
Bought by
Race Donald L and Race Kathryn M
Purchase Details
Closed on
Jun 1, 1994
Sold by
Gingras Eugene Fn and Gingras Lisa A
Bought by
Halterman Scott A and Halterman Karen E
Purchase Details
Closed on
Feb 22, 1989
Sold by
Nolan Mark F
Bought by
Gingrass Ii Eugene F N
Create a Home Valuation Report for This Property
The Home Valuation Report is an in-depth analysis detailing your home's value as well as a comparison with similar homes in the area
Home Values in the Area
Average Home Value in this Area
Purchase History
| Date | Buyer | Sale Price | Title Company |
|---|---|---|---|
| Race Kathryn M | -- | -- | |
| Race Donald L | $117,000 | -- | |
| Halterman Scott A | $94,000 | -- | |
| Gingrass Ii Eugene F N | $135,500 | -- |
Source: Public Records
Mortgage History
| Date | Status | Borrower | Loan Amount |
|---|---|---|---|
| Open | Gingrass Ii Eugene F N | $371,700 | |
| Closed | Gingrass Ii Eugene F N | $363,800 |
Source: Public Records
Tax History
| Year | Tax Paid | Tax Assessment Tax Assessment Total Assessment is a certain percentage of the fair market value that is determined by local assessors to be the total taxable value of land and additions on the property. | Land | Improvement |
|---|---|---|---|---|
| 2025 | $7,502 | $571,800 | $224,200 | $347,600 |
| 2024 | $6,832 | $536,300 | $219,900 | $316,400 |
| 2023 | $6,651 | $490,100 | $190,600 | $299,500 |
| 2022 | $6,500 | $446,400 | $173,300 | $273,100 |
| 2021 | $6,428 | $414,700 | $159,200 | $255,500 |
| 2020 | $6,334 | $399,600 | $144,100 | $255,500 |
| 2019 | $5,360 | $348,500 | $144,100 | $204,400 |
| 2018 | $5,205 | $325,100 | $136,500 | $188,600 |
| 2017 | $4,717 | $312,800 | $136,500 | $176,300 |
| 2016 | $4,719 | $302,700 | $130,000 | $172,700 |
| 2015 | $4,792 | $307,000 | $130,000 | $177,000 |
Source: Public Records
Map
Nearby Homes
- 56-58 Vernon St
- 48 Sullivan Terrace
- 42 Rock St
- 110 South Ave
- 1142 Washington St
- 61 Suffolk St
- 95 Temple St
- 8 Laurel St
- 118 Temple St
- 147 South Ave
- 1190 Bedford St Unit G3
- 48 Day St
- 291 Raynor Ave
- 608 Plymouth St
- 74 Benson St
- 99 Washington St
- 260 Walnut St
- 170 Pleasant St
- 66 Belmont St
- 289 Commercial St
Your Personal Tour Guide
Ask me questions while you tour the home.