97 High St Tilton, NH 03276
Tilton NeighborhoodEstimated Value: $306,000 - $382,000
About This Home
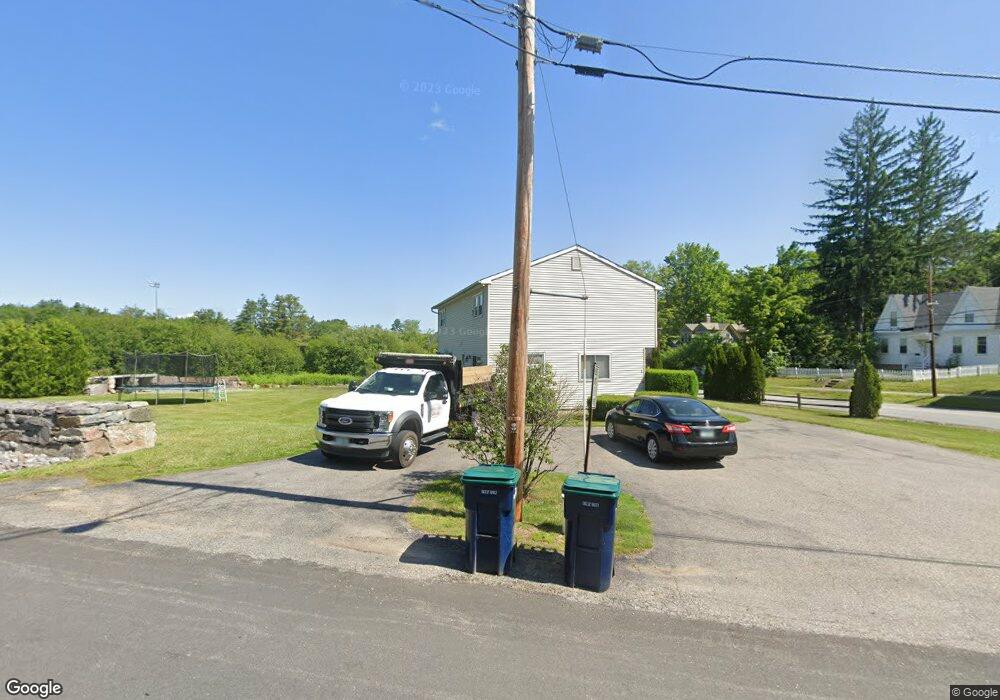
This home is located at 97 High St, Tilton, NH 03276 and is currently estimated at $333,684, approximately $386 per square foot. 97 High St is a home located in Belknap County with nearby schools including Southwick School, Winnisquam Regional Middle School, and Winnisquam Regional High School.
Ownership History
We collect this data history from publicly available records. To have your information removed, we recommend requesting removal directly through your county’s website.
Purchase Details
Purchase Details
Home Values in the Area
Average Home Value in this Area
Purchase History
We collect this data history from publicly available records. To have your information removed, we recommend requesting removal directly through your county’s website.
| Date | Buyer | Sale Price | Title Company |
|---|---|---|---|
| -- | -- | ||
| -- | -- | ||
| $80,000 | -- | ||
| $80,000 | -- |
Mortgage History
We collect this data history from publicly available records. To have your information removed, we recommend requesting removal directly through your county’s website.
| Date | Status | Borrower | Loan Amount |
|---|---|---|---|
| Previous Owner | $89,237 | ||
| Previous Owner | $91,000 | ||
| Closed | $0 |
Tax History
We collect this data history from publicly available records. To have your information removed, we recommend requesting removal directly through your county’s website.
| Year | Tax Paid | Tax Assessment Tax Assessment Total Assessment is a certain percentage of the fair market value that is determined by local assessors to be the total taxable value of land and additions on the property. | Land | Improvement |
|---|---|---|---|---|
| 2025 | $2,737 | $242,400 | $99,200 | $143,200 |
| 2024 | $2,618 | $242,400 | $99,200 | $143,200 |
| 2023 | $2,439 | $137,700 | $52,200 | $85,500 |
| 2022 | $2,213 | $137,700 | $52,200 | $85,500 |
| 2021 | $2,271 | $138,800 | $52,200 | $86,600 |
| 2020 | $4,128 | $132,900 | $52,200 | $80,700 |
| 2019 | $2,990 | $132,900 | $52,200 | $80,700 |
| 2018 | $2,932 | $102,900 | $42,100 | $60,800 |
| 2017 | $2,212 | $102,900 | $42,100 | $60,800 |
| 2016 | $2,809 | $102,900 | $42,100 | $60,800 |
| 2015 | $2,364 | $102,900 | $42,100 | $60,800 |
| 2014 | $2,047 | $102,800 | $42,100 | $60,700 |
| 2013 | $1,867 | $102,000 | $42,100 | $59,900 |
| 2012 | $1,862 | $102,000 | $42,100 | $59,900 |
Map
- 61 High St
- 7 West St
- 39 Chestnut St
- 8 West St
- 119 School St
- R02-13 Calef Hill Rd
- 221 School St
- 26 Howard Ave
- 495 W Main St
- 00 Windfall Rd Unit 4
- 2 Wentworth Ave
- 9 Aspen Rd
- 30 Forrest Rd
- 1 Marsh Hill Cir
- 24 Foothills Way
- 4 Hemlock Rd
- 1 Woodgate Cir
- 11 Northbrook Dr
- 32 Bean Hill Rd
- 12 Village Way Unit 38
Ask me questions while you tour the home.