97 Johnson Rd Otsego, MI 49078
Estimated Value: $210,000 - $257,000
3
Beds
2
Baths
1,344
Sq Ft
$169/Sq Ft
Est. Value
About This Home
This home is located at 97 Johnson Rd, Otsego, MI 49078 and is currently estimated at $227,667, approximately $169 per square foot. 97 Johnson Rd is a home located in Allegan County with nearby schools including Otsego High School, St. Margaret School, and Otsego Christian Academy.
Ownership History
Date
Name
Owned For
Owner Type
Purchase Details
Closed on
Dec 14, 2001
Sold by
Syers Shirley and Howrigon Dixie
Bought by
Nast Renee Marie and Nast Renee
Current Estimated Value
Home Financials for this Owner
Home Financials are based on the most recent Mortgage that was taken out on this home.
Original Mortgage
$22,500
Interest Rate
6.53%
Mortgage Type
Balloon
Purchase Details
Closed on
Oct 22, 1998
Sold by
Johnson Steven E and Johnson Joyce D
Bought by
Syers Shirley and Howrigon Dixie
Create a Home Valuation Report for This Property
The Home Valuation Report is an in-depth analysis detailing your home's value as well as a comparison with similar homes in the area
Home Values in the Area
Average Home Value in this Area
Purchase History
| Date | Buyer | Sale Price | Title Company |
|---|---|---|---|
| Nast Renee Marie | $23,000 | Chicago Title Of Michigan In | |
| Syers Shirley | $20,000 | -- |
Source: Public Records
Mortgage History
| Date | Status | Borrower | Loan Amount |
|---|---|---|---|
| Closed | Nast Renee Marie | $22,500 |
Source: Public Records
Tax History
| Year | Tax Paid | Tax Assessment Tax Assessment Total Assessment is a certain percentage of the fair market value that is determined by local assessors to be the total taxable value of land and additions on the property. | Land | Improvement |
|---|---|---|---|---|
| 2025 | $1,840 | $107,000 | $12,900 | $94,100 |
| 2024 | $1,556 | $95,100 | $12,500 | $82,600 |
| 2023 | $1,583 | $81,900 | $12,000 | $69,900 |
| 2022 | $1,556 | $75,300 | $12,000 | $63,300 |
| 2021 | $1,466 | $71,600 | $11,300 | $60,300 |
| 2020 | $1,404 | $65,700 | $10,700 | $55,000 |
| 2019 | $1,354 | $57,700 | $8,300 | $49,400 |
| 2018 | $1,325 | $56,700 | $8,500 | $48,200 |
| 2017 | $0 | $56,900 | $7,200 | $49,700 |
| 2016 | $0 | $49,300 | $7,200 | $42,100 |
| 2015 | -- | $49,300 | $7,200 | $42,100 |
| 2014 | $1,447 | $46,600 | $7,000 | $39,600 |
| 2013 | $1,447 | $39,700 | $8,600 | $31,100 |
Source: Public Records
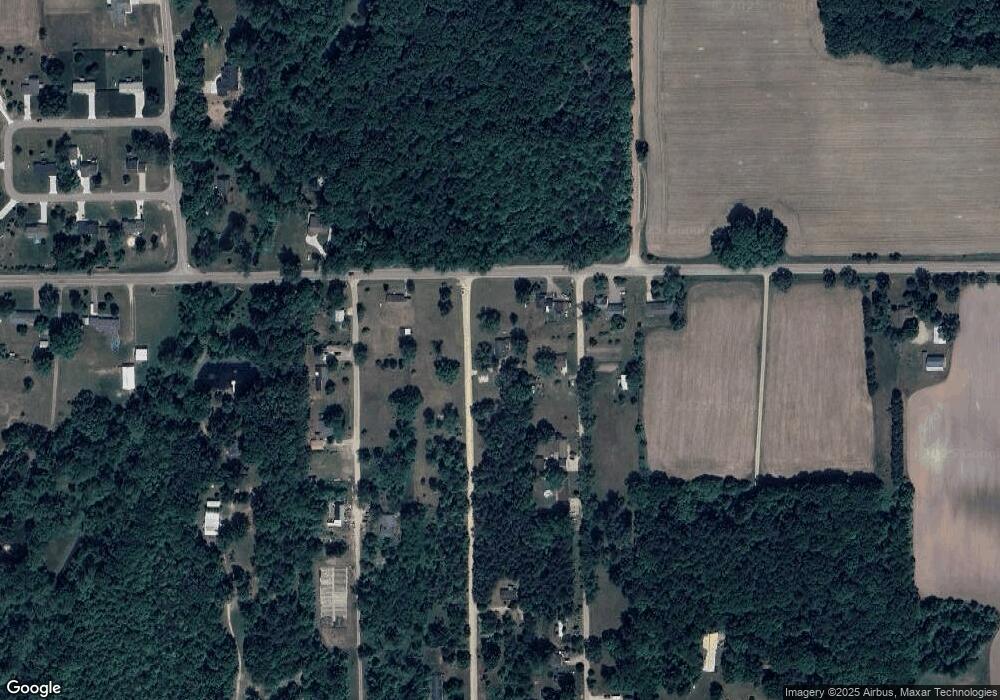
Map
Nearby Homes
- 70 20th St
- 2222 101st Ave
- 1660 Aspen Trail
- 1655 Aspen Trail
- 1648 Aspen Trail
- 0 Briarwood St Unit 25002251
- 1644 Aspen Trail
- 1639 Aspen Trail
- 1636 Aspen Trail
- Integrity 1880 Plan at Southpointe Trails
- Integrity 1910 Plan at Southpointe Trails
- Integrity 1250 Plan at Southpointe Trails
- Integrity 1750 Plan at Southpointe Trails
- Integrity 2000 Plan at Southpointe Trails
- Elements 2100 Plan at Southpointe Trails
- Elements 2700 Plan at Southpointe Trails
- Integrity 1560 Plan at Southpointe Trails
- Elements 2070 Plan at Southpointe Trails
- integrity 2280 Plan at Southpointe Trails
- Integrity 2080 Plan at Southpointe Trails
Your Personal Tour Guide
Ask me questions while you tour the home.