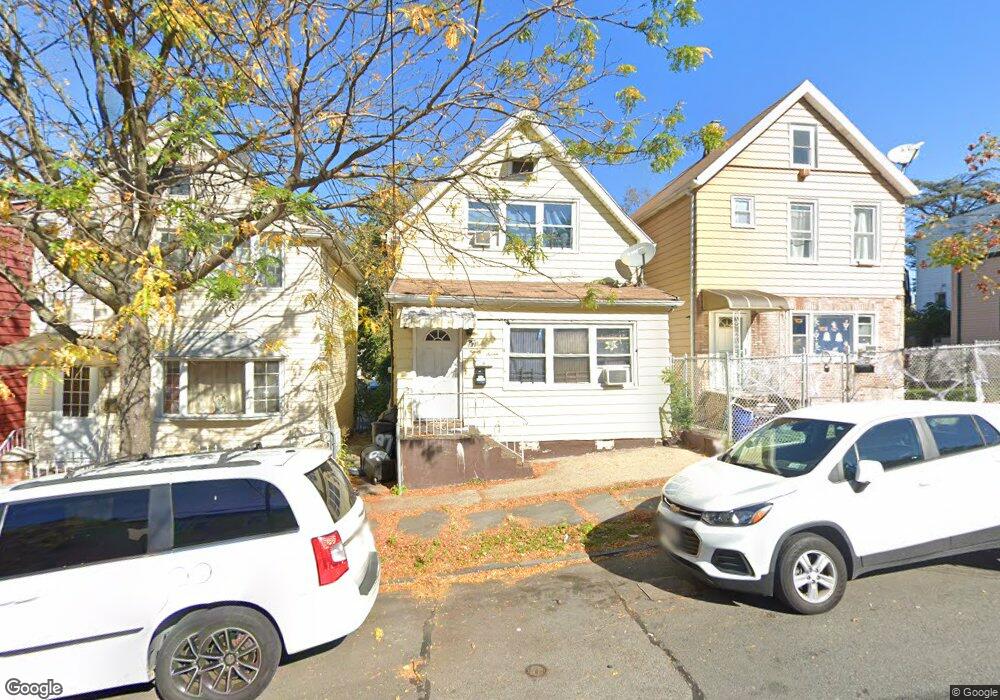
97 Laurel Ave Staten Island, NY 10304
Stapleton NeighborhoodEstimated Value: $501,544 - $564,000
4
Beds
2
Baths
1,040
Sq Ft
$509/Sq Ft
Est. Value
About This Home
This home is located at 97 Laurel Ave, Staten Island, NY 10304 and is currently estimated at $529,136, approximately $508 per square foot. 97 Laurel Ave is a home located in Richmond County with nearby schools including P.S. 78, P.S./I.S. 78Q Early Childhood Center, and I.S. 49 Berta A Dreyfus.
Ownership History
Date
Name
Owned For
Owner Type
Purchase Details
Closed on
Mar 7, 2005
Sold by
Collado Rebecca
Bought by
Shelse Nicholas
Current Estimated Value
Home Financials for this Owner
Home Financials are based on the most recent Mortgage that was taken out on this home.
Original Mortgage
$243,376
Interest Rate
5.67%
Mortgage Type
Fannie Mae Freddie Mac
Purchase Details
Closed on
Dec 6, 2002
Sold by
Dimonda Marlo
Bought by
Collado Rebecca
Home Financials for this Owner
Home Financials are based on the most recent Mortgage that was taken out on this home.
Original Mortgage
$166,950
Interest Rate
5.95%
Mortgage Type
Purchase Money Mortgage
Purchase Details
Closed on
Nov 2, 2001
Sold by
Sandrakumar Sabaratnam
Bought by
Dimonda Marlo
Home Financials for this Owner
Home Financials are based on the most recent Mortgage that was taken out on this home.
Original Mortgage
$140,780
Interest Rate
6.84%
Mortgage Type
FHA
Create a Home Valuation Report for This Property
The Home Valuation Report is an in-depth analysis detailing your home's value as well as a comparison with similar homes in the area
Home Values in the Area
Average Home Value in this Area
Purchase History
| Date | Buyer | Sale Price | Title Company |
|---|---|---|---|
| Shelse Nicholas | $304,200 | -- | |
| Collado Rebecca | $185,500 | Newell & Talarico | |
| Dimonda Marlo | $143,000 | Fidelity National Title Ins |
Source: Public Records
Mortgage History
| Date | Status | Borrower | Loan Amount |
|---|---|---|---|
| Previous Owner | Shelse Nicholas | $243,376 | |
| Previous Owner | Collado Rebecca | $166,950 | |
| Previous Owner | Dimonda Marlo | $140,780 |
Source: Public Records
Tax History Compared to Growth
Tax History
| Year | Tax Paid | Tax Assessment Tax Assessment Total Assessment is a certain percentage of the fair market value that is determined by local assessors to be the total taxable value of land and additions on the property. | Land | Improvement |
|---|---|---|---|---|
| 2025 | $3,885 | $28,380 | $6,346 | $22,034 |
| 2024 | $3,885 | $28,800 | $6,206 | $22,594 |
| 2023 | $3,706 | $18,248 | $6,287 | $11,961 |
| 2022 | $3,437 | $23,280 | $9,240 | $14,040 |
| 2021 | $3,418 | $23,220 | $9,240 | $13,980 |
| 2020 | $3,500 | $22,920 | $9,240 | $13,680 |
| 2019 | $3,372 | $20,640 | $9,240 | $11,400 |
| 2018 | $3,100 | $15,207 | $7,628 | $7,579 |
| 2017 | $2,925 | $14,347 | $7,780 | $6,567 |
| 2016 | $2,706 | $13,536 | $7,042 | $6,494 |
| 2015 | $2,578 | $13,536 | $7,533 | $6,003 |
| 2014 | $2,578 | $13,433 | $6,823 | $6,610 |
Source: Public Records
Map
Nearby Homes
- 95 Laurel Ave
- 101 Laurel Ave
- 93 Laurel Ave
- 105 Laurel Ave
- 89-91 Laurel Ave
- 89 Laurel Ave Unit 91
- 109 Laurel Ave
- 111 Laurel Ave
- 85 Laurel Ave
- 113 Laurel Ave
- 165 Fulton St
- 83 Laurel Ave
- 96 Laurel Ave
- 98 Laurel Ave
- 98 1/2 Laurel Ave
- 161 Fulton St
- 81 Laurel Ave
- 112 Warren St
- 100 Laurel Ave
- 114 Warren St