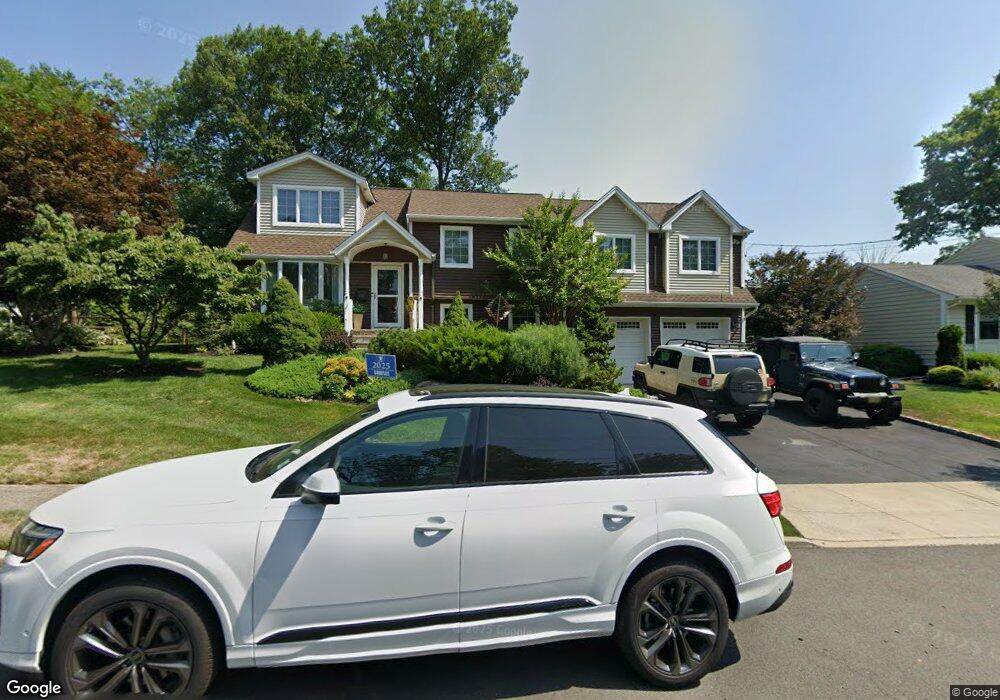
97 Lilyan St Waldwick, NJ 07463
Estimated Value: $774,000 - $1,025,521
--
Bed
--
Bath
3,176
Sq Ft
$293/Sq Ft
Est. Value
About This Home
This home is located at 97 Lilyan St, Waldwick, NJ 07463 and is currently estimated at $929,880, approximately $292 per square foot. 97 Lilyan St is a home located in Bergen County with nearby schools including Waldwick High School, The Village School - Montessori, and The Forum School.
Ownership History
Date
Name
Owned For
Owner Type
Purchase Details
Closed on
Aug 8, 2006
Sold by
Campbell Robert J
Bought by
Desousa Mary De
Current Estimated Value
Home Financials for this Owner
Home Financials are based on the most recent Mortgage that was taken out on this home.
Original Mortgage
$360,000
Outstanding Balance
$216,959
Interest Rate
6.83%
Estimated Equity
$712,921
Purchase Details
Closed on
Nov 14, 1997
Sold by
Campbell Murray Catherine and Campbell Gilbert J
Bought by
Campbell Robert James and Campbell Elizabeth Lapin
Create a Home Valuation Report for This Property
The Home Valuation Report is an in-depth analysis detailing your home's value as well as a comparison with similar homes in the area
Home Values in the Area
Average Home Value in this Area
Purchase History
| Date | Buyer | Sale Price | Title Company |
|---|---|---|---|
| Desousa Mary De | $450,000 | -- | |
| Campbell Robert James | $167,500 | Quest Title Agency Inc |
Source: Public Records
Mortgage History
| Date | Status | Borrower | Loan Amount |
|---|---|---|---|
| Open | Desousa Mary De | $360,000 |
Source: Public Records
Tax History Compared to Growth
Tax History
| Year | Tax Paid | Tax Assessment Tax Assessment Total Assessment is a certain percentage of the fair market value that is determined by local assessors to be the total taxable value of land and additions on the property. | Land | Improvement |
|---|---|---|---|---|
| 2025 | $18,148 | $825,800 | $354,900 | $470,900 |
| 2024 | $16,372 | $819,700 | $354,900 | $464,800 |
| 2023 | $16,034 | $563,000 | $308,600 | $254,400 |
| 2022 | $16,034 | $563,000 | $308,600 | $254,400 |
| 2021 | $15,730 | $563,000 | $308,600 | $254,400 |
| 2020 | $15,578 | $563,000 | $308,600 | $254,400 |
| 2019 | $15,573 | $563,000 | $308,600 | $254,400 |
| 2018 | $15,083 | $563,000 | $308,600 | $254,400 |
| 2017 | $14,953 | $563,000 | $308,600 | $254,400 |
| 2016 | $14,649 | $563,000 | $308,600 | $254,400 |
| 2015 | $14,480 | $563,000 | $308,600 | $254,400 |
| 2014 | $14,131 | $563,000 | $308,600 | $254,400 |
Source: Public Records
Map
Nearby Homes