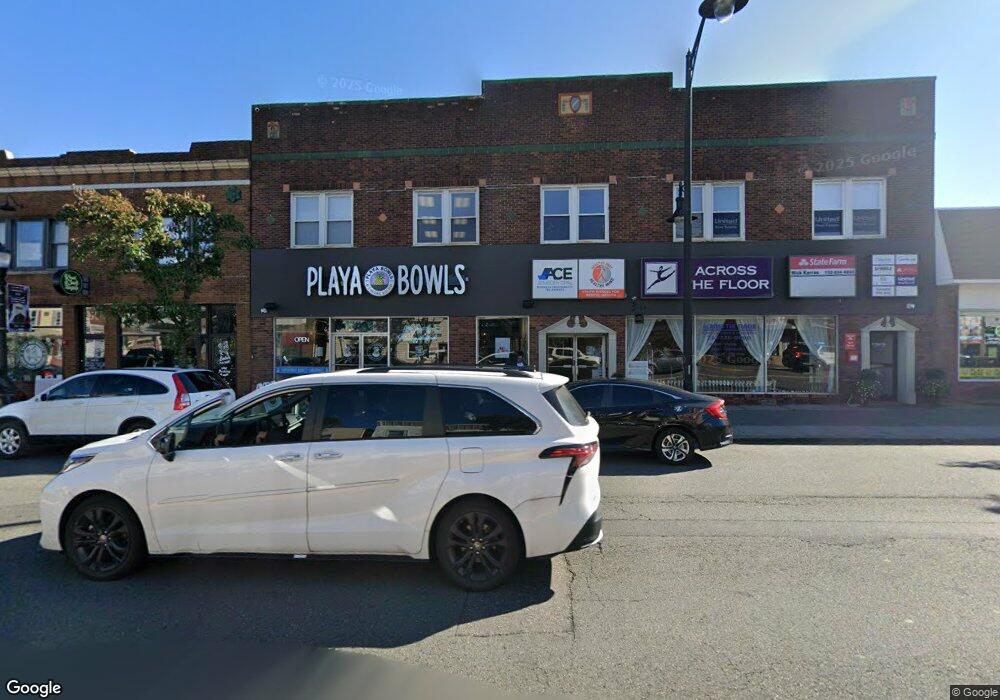
97 Main St Unit 204 Woodbridge, NJ 07095
Estimated Value: $2,060,175
--
Bed
--
Bath
325
Sq Ft
$6,339/Sq Ft
Est. Value
About This Home
This home is located at 97 Main St Unit 204, Woodbridge, NJ 07095 and is currently priced at $2,060,175, approximately $6,339 per square foot. 97 Main St Unit 204 is a home located in Middlesex County with nearby schools including Ross Street Elementary School, Woodbridge Middle School, and Woodbridge High School.
Ownership History
Date
Name
Owned For
Owner Type
Purchase Details
Closed on
Jul 13, 1998
Sold by
Christensens Dept
Bought by
Tes Sa Sao Llc
Current Estimated Value
Home Financials for this Owner
Home Financials are based on the most recent Mortgage that was taken out on this home.
Original Mortgage
$390,000
Interest Rate
6.92%
Mortgage Type
Commercial
Create a Home Valuation Report for This Property
The Home Valuation Report is an in-depth analysis detailing your home's value as well as a comparison with similar homes in the area
Home Values in the Area
Average Home Value in this Area
Purchase History
| Date | Buyer | Sale Price | Title Company |
|---|---|---|---|
| Tes Sa Sao Llc | $585,000 | -- |
Source: Public Records
Mortgage History
| Date | Status | Borrower | Loan Amount |
|---|---|---|---|
| Previous Owner | Tes Sa Sao Llc | $390,000 |
Source: Public Records
Tax History Compared to Growth
Tax History
| Year | Tax Paid | Tax Assessment Tax Assessment Total Assessment is a certain percentage of the fair market value that is determined by local assessors to be the total taxable value of land and additions on the property. | Land | Improvement |
|---|---|---|---|---|
| 2025 | $37,221 | $275,000 | $107,700 | $167,300 |
| 2024 | $36,300 | $275,000 | $107,700 | $167,300 |
| 2023 | $36,300 | $275,000 | $107,700 | $167,300 |
| 2022 | $34,089 | $275,000 | $107,700 | $167,300 |
| 2021 | $33,737 | $275,000 | $107,700 | $167,300 |
| 2020 | $32,626 | $275,000 | $107,700 | $167,300 |
| 2019 | $31,798 | $275,000 | $107,700 | $167,300 |
| 2018 | $46,646 | $414,300 | $107,700 | $306,600 |
| 2017 | $45,706 | $414,300 | $107,700 | $306,600 |
| 2016 | $45,271 | $414,300 | $107,700 | $306,600 |
| 2015 | $44,380 | $414,300 | $107,700 | $306,600 |
| 2014 | $43,323 | $414,300 | $107,700 | $306,600 |
Source: Public Records
Map
Nearby Homes
- 65 Green St
- 62 Green St
- 13 Lillian Terrace
- 152 Bunns Ln
- 191 Sherry St
- 15 Rector Ave
- 15 Rector Ave Unit 2
- 29 Claire Ave
- 46 Melbourne Ct
- 2 Metuchen Ave
- 341 Grady Dr
- 52 Martin Terrace
- 183 Strawberry Hill Ave
- 585 Noe Ave
- 524 Bamford Ave
- 587 Ellis Place
- 200 Mawbey St
- 60 Crampton Ave
- 532 Bamford Ave
- 55 Metuchen Ave
- 97 Main St Unit Rear
- 97 Main St Unit Front
- 97 Main St Unit 1
- 97 Main St
- 97 Main Suite 201-202 St
- 93 Main St
- 92 New St
- 87 Main St
- 86 New St
- 103 New St
- 100 Main St
- 98 Main St Unit 98A
- 110 New St
- 96 Main St Unit 2L
- 96 Main St
- 107 Main St
- 98 Main St
- 98 Main St Unit 1-5
- 98 Main St Unit 1-6
- 98 Main St Unit 98A