97 Maynard St Northborough, MA 01532
Estimated Value: $631,000 - $774,653
3
Beds
3
Baths
1,548
Sq Ft
$447/Sq Ft
Est. Value
About This Home
This home is located at 97 Maynard St, Northborough, MA 01532 and is currently estimated at $691,663, approximately $446 per square foot. 97 Maynard St is a home located in Worcester County with nearby schools including Marion E. Zeh Elementary School, Robert E. Melican Middle School, and Algonquin Regional High School.
Ownership History
Date
Name
Owned For
Owner Type
Purchase Details
Closed on
May 2, 2025
Sold by
Vesel John E and Vesel Judith H
Bought by
John E Vesel Lt and Vesel
Current Estimated Value
Purchase Details
Closed on
Jun 1, 1983
Bought by
Vesel John E and Vesel Judith H
Create a Home Valuation Report for This Property
The Home Valuation Report is an in-depth analysis detailing your home's value as well as a comparison with similar homes in the area
Home Values in the Area
Average Home Value in this Area
Purchase History
| Date | Buyer | Sale Price | Title Company |
|---|---|---|---|
| John E Vesel Lt | -- | None Available | |
| John E Vesel Lt | -- | None Available | |
| Vesel John E | $110,000 | -- |
Source: Public Records
Mortgage History
| Date | Status | Borrower | Loan Amount |
|---|---|---|---|
| Previous Owner | Vesel John E | $80,000 | |
| Previous Owner | Vesel John E | $90,000 |
Source: Public Records
Tax History
| Year | Tax Paid | Tax Assessment Tax Assessment Total Assessment is a certain percentage of the fair market value that is determined by local assessors to be the total taxable value of land and additions on the property. | Land | Improvement |
|---|---|---|---|---|
| 2025 | $10,055 | $705,600 | $373,100 | $332,500 |
| 2024 | $8,627 | $604,100 | $293,500 | $310,600 |
| 2023 | $8,852 | $598,500 | $280,700 | $317,800 |
| 2022 | $8,708 | $528,100 | $270,300 | $257,800 |
| 2021 | $8,447 | $493,400 | $251,500 | $241,900 |
| 2020 | $8,508 | $493,200 | $251,500 | $241,700 |
| 2019 | $8,227 | $479,700 | $229,800 | $249,900 |
| 2018 | $7,711 | $443,400 | $221,500 | $221,900 |
| 2017 | $7,380 | $424,400 | $221,500 | $202,900 |
| 2016 | $7,163 | $417,200 | $218,100 | $199,100 |
| 2015 | $7,010 | $419,000 | $222,900 | $196,100 |
| 2014 | $6,553 | $395,000 | $222,900 | $172,100 |
Source: Public Records
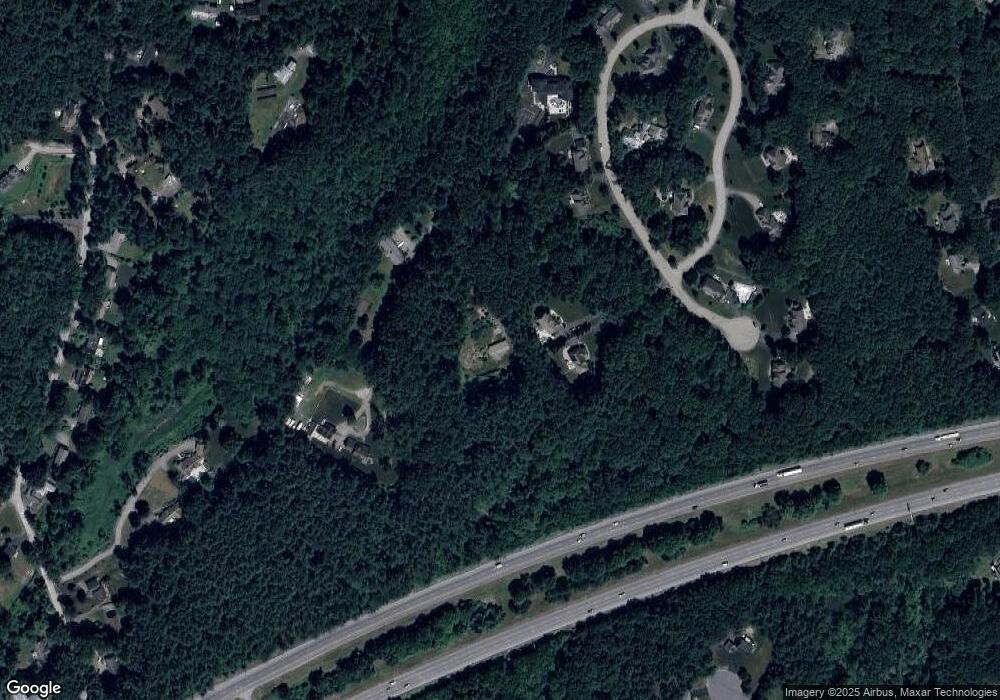
Map
Nearby Homes
- 429 Howard St
- 460 Whitney St
- 122 Green St
- 202 Brewer St
- 210 Green St
- 1A Mentzer Ave
- 12 Patrick Dr
- 165 Rice Ave
- 125 Rice Ave
- 27 Autumn Ln
- 6 Silas Dr
- 18 Alden Dr Unit 3
- 356 Church St
- 165 Lyman Rd
- 39 Pleasant St Unit A6
- 39 Pleasant St Unit A17
- 39 Pleasant St Unit B4
- 390 Hudson St
- 26 John Edward Dr
- 7 Ledge Brook Dr
- 26 Beechwood Cir
- 30 Beechwood Cir
- 22 Beechwood Cir
- 109 Maynard St
- 18 Beechwood Cir
- 27 Beechwood Cir
- 14 Beechwood Cir
- 93 Maynard St
- 34 Beechwood Cir
- 23 Beechwood Cir
- Lot 3 Beechwood Cir
- Lot 4 Beechwood Cir
- 15 Beechwood Cir
- 31 Beechwood Cir
- 9 Beechwood Cir
- 2 Beechwood Cir
- 296 Howard St
- 10 Beechwood Cir
- 117 Maynard St
- 292 Howard St
Your Personal Tour Guide
Ask me questions while you tour the home.