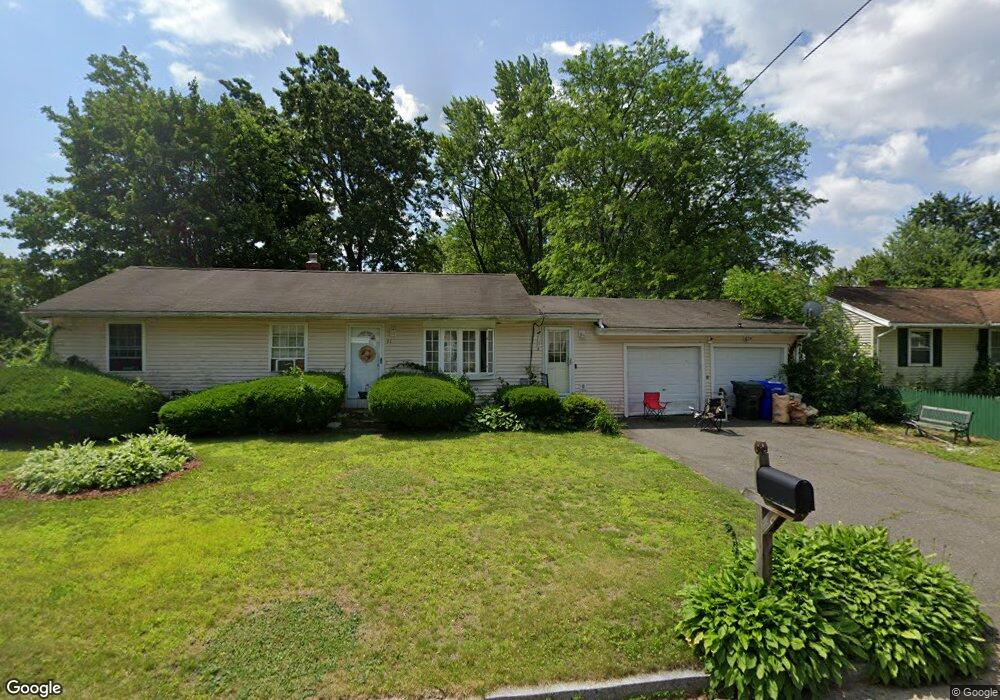
97 Navajo Rd Springfield, MA 01109
Sixteen Acres NeighborhoodEstimated Value: $289,000 - $365,000
About This Home
This home is located at 97 Navajo Rd, Springfield, MA 01109 and is currently estimated at $324,535, approximately $187 per square foot. 97 Navajo Rd is a home located in Hampden County with nearby schools including Frank H. Freedman School, John J Duggan Middle, and Springfield High School of Science and Technology.
Ownership History
We collect this data history from publicly available records. To have your information removed, we recommend requesting removal directly through your county’s website.
Purchase Details
Purchase Details
Home Financials for this Owner
Home Financials are based on the most recent Mortgage that was taken out on this home.Home Values in the Area
Average Home Value in this Area
Purchase History
We collect this data history from publicly available records. To have your information removed, we recommend requesting removal directly through your county’s website.
| Date | Buyer | Sale Price | Title Company |
|---|---|---|---|
| -- | -- | ||
| $60,000 | -- |
Mortgage History
We collect this data history from publicly available records. To have your information removed, we recommend requesting removal directly through your county’s website.
| Date | Status | Borrower | Loan Amount |
|---|---|---|---|
| Previous Owner | $154,000 | ||
| Previous Owner | $141,600 | ||
| Previous Owner | $119,000 | ||
| Previous Owner | $102,600 | ||
| Previous Owner | $76,500 | ||
| Previous Owner | $64,250 |
Tax History
We collect this data history from publicly available records. To have your information removed, we recommend requesting removal directly through your county’s website.
| Year | Tax Paid | Tax Assessment Tax Assessment Total Assessment is a certain percentage of the fair market value that is determined by local assessors to be the total taxable value of land and additions on the property. | Land | Improvement |
|---|---|---|---|---|
| 2025 | $4,274 | $272,600 | $51,700 | $220,900 |
| 2024 | $4,264 | $265,500 | $51,700 | $213,800 |
| 2023 | $4,395 | $257,800 | $49,200 | $208,600 |
| 2022 | $3,760 | $199,800 | $49,200 | $150,600 |
| 2021 | $3,648 | $193,000 | $44,700 | $148,300 |
| 2020 | $3,642 | $186,500 | $44,700 | $141,800 |
| 2019 | $3,184 | $161,800 | $44,700 | $117,100 |
| 2018 | $3,255 | $165,400 | $44,700 | $120,700 |
| 2017 | $3,089 | $157,100 | $49,600 | $107,500 |
| 2016 | $2,864 | $145,700 | $49,600 | $96,100 |
| 2015 | $2,811 | $142,900 | $49,600 | $93,300 |
Map
- 306 Greenaway Dr
- 74 Leatherleaf Dr
- 915 Bradley Rd
- 85 Keddy St
- 101 Old Farm Rd
- 60 Keddy St
- 168 Keddy St
- 149 Old Farm Rd
- 647 Plumtree Rd
- 109 Bretton Rd
- 99 Lakevilla Ave
- 87 Lakevilla Ave
- 210 Winton St
- 235 Chalmers St
- 291 Old Farm Rd
- 43 Pine Hill Rd
- 974 Wilbraham Rd
- 15 Monticello Ave
- 865 Wilbraham Rd
- 55 Bridle Path Rd
Ask me questions while you tour the home.