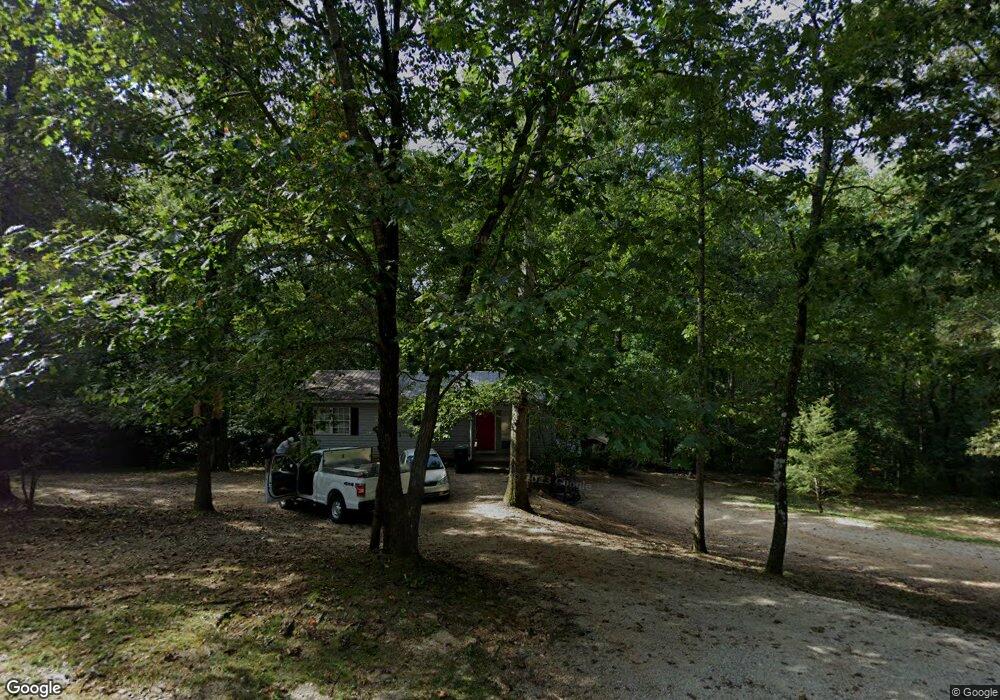
97 Pony Lake Ln Dahlonega, GA 30533
Estimated Value: $313,773 - $373,000
--
Bed
2
Baths
2,000
Sq Ft
$168/Sq Ft
Est. Value
About This Home
This home is located at 97 Pony Lake Ln, Dahlonega, GA 30533 and is currently estimated at $336,193, approximately $168 per square foot. 97 Pony Lake Ln is a home located in Lumpkin County with nearby schools including Lumpkin County High School.
Ownership History
Date
Name
Owned For
Owner Type
Purchase Details
Closed on
Jan 2, 2024
Sold by
Smith Christopher Mark
Bought by
Martin Charles A
Current Estimated Value
Purchase Details
Closed on
Aug 10, 2005
Sold by
Brookshire Horace
Bought by
Smith Christopher Mark
Home Financials for this Owner
Home Financials are based on the most recent Mortgage that was taken out on this home.
Original Mortgage
$107,000
Interest Rate
5.61%
Mortgage Type
New Conventional
Purchase Details
Closed on
Jul 8, 2005
Sold by
The Nature Conservancy
Bought by
United States Of America Co
Home Financials for this Owner
Home Financials are based on the most recent Mortgage that was taken out on this home.
Original Mortgage
$107,000
Interest Rate
5.61%
Mortgage Type
New Conventional
Purchase Details
Closed on
Sep 4, 1998
Sold by
Penland Jerry
Bought by
Brookshire Horace
Purchase Details
Closed on
Aug 14, 1989
Bought by
Penland Jerry
Create a Home Valuation Report for This Property
The Home Valuation Report is an in-depth analysis detailing your home's value as well as a comparison with similar homes in the area
Home Values in the Area
Average Home Value in this Area
Purchase History
| Date | Buyer | Sale Price | Title Company |
|---|---|---|---|
| Martin Charles A | $185,000 | -- | |
| Smith Christopher Mark | $115,000 | -- | |
| United States Of America Co | -- | -- | |
| Brookshire Horace | $28,000 | -- | |
| Penland Jerry | -- | -- |
Source: Public Records
Mortgage History
| Date | Status | Borrower | Loan Amount |
|---|---|---|---|
| Previous Owner | Smith Christopher Mark | $107,000 |
Source: Public Records
Tax History Compared to Growth
Tax History
| Year | Tax Paid | Tax Assessment Tax Assessment Total Assessment is a certain percentage of the fair market value that is determined by local assessors to be the total taxable value of land and additions on the property. | Land | Improvement |
|---|---|---|---|---|
| 2024 | $2,254 | $79,104 | $10,251 | $68,853 |
| 2023 | $1,750 | $74,391 | $9,580 | $64,811 |
| 2022 | $1,556 | $62,847 | $7,984 | $54,863 |
| 2021 | $1,407 | $54,960 | $7,984 | $46,976 |
| 2020 | $1,413 | $53,557 | $7,646 | $45,911 |
| 2019 | $1,426 | $53,557 | $7,646 | $45,911 |
| 2018 | $1,363 | $48,059 | $7,646 | $40,413 |
| 2017 | $1,356 | $46,886 | $7,646 | $39,240 |
| 2016 | $1,270 | $42,453 | $7,646 | $34,807 |
| 2015 | $1,130 | $42,453 | $7,646 | $34,807 |
| 2014 | $1,130 | $42,849 | $7,646 | $35,202 |
| 2013 | -- | $43,244 | $7,646 | $35,597 |
Source: Public Records
Map
Nearby Homes
- 39 E Point Dr
- 391 Pinewood Place
- 459 Gold Ridge Rd
- 6292 Timber Creek Trail
- 125 Lake Laurel Dr
- 6278 Rufus Bryant Rd
- 75 Melody Ln
- 6439 S Chestatee
- 85 Waterloo Dr
- 162 Stoneridge Dr
- 433 Elliots Ln
- 6038 S Chestatee
- 6592 Rufus Bryant Rd
- 70 Wessex Ct
- 6266 Yellow Creek Rd
- 0 Robinson Rd Unit 10597950
- 0 Robinson Rd Unit 7643549
- 5937 Thompson Bridge Rd
- 0 Long Branch Rd Unit 10271720
- 0 Long Branch Rd Unit 10271266
- 139 Pony Lake Ln
- 709 Pony Lake Rd
- 170 Pony Lake Ln
- 6901 Pony Lake Rd
- 0 Pony Lake Ln Unit 8735617
- 581 Pony Lake Rd
- 589 Pony Lake Rd
- 141 Pony Lake Ln
- 39 Doubletree Cir
- 6908 Pony Lake Rd
- 756 Pony Lake Rd
- 428 Pony Lake Ln
- 85 Doubletree Cir
- 379 Pony Lake Ln
- 315 Pony Lake Ln
- 590 Pony Lake Rd
- 266 Pony Lake Ln
- 423 Pony Lake Ln
- 31 Pinewood Place
- 6928 Pony Lake Rd