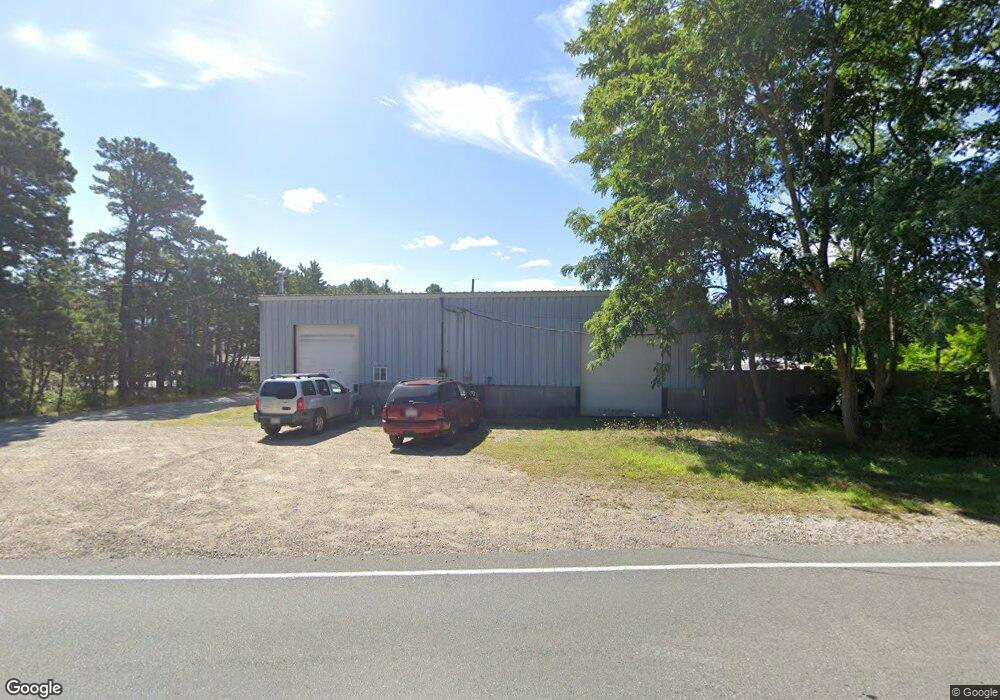
97 Queen Anne Rd Harwich, MA 2645
Northwest Harwich NeighborhoodEstimated Value: $1,227,678
--
Bed
--
Bath
3,000
Sq Ft
$409/Sq Ft
Est. Value
About This Home
This home is located at 97 Queen Anne Rd, Harwich, MA 2645 and is currently estimated at $1,227,678, approximately $409 per square foot. 97 Queen Anne Rd is a home located in Barnstable County with nearby schools including Harwich Elementary School, Chatham Elementary School, and Monomoy Regional Middle School.
Ownership History
Date
Name
Owned For
Owner Type
Purchase Details
Closed on
Sep 16, 2010
Sold by
Smith Robert E
Bought by
Our John D
Current Estimated Value
Purchase Details
Closed on
Mar 31, 2009
Sold by
J & B Our Rt
Bought by
Our John D and Our Barbara O
Purchase Details
Closed on
Oct 10, 2007
Sold by
Moore Barbara A and Moore Richard V
Bought by
J & B Our Rt
Home Financials for this Owner
Home Financials are based on the most recent Mortgage that was taken out on this home.
Original Mortgage
$275,000
Interest Rate
6.74%
Mortgage Type
Commercial
Purchase Details
Closed on
Sep 10, 2007
Sold by
Gause Dill Clyde Clayton and Gause Dill Patricia
Bought by
J & B Our Rt
Home Financials for this Owner
Home Financials are based on the most recent Mortgage that was taken out on this home.
Original Mortgage
$275,000
Interest Rate
6.74%
Mortgage Type
Commercial
Purchase Details
Closed on
Jan 22, 1999
Sold by
Bechtolt Linda S
Bought by
Davenport Rt
Create a Home Valuation Report for This Property
The Home Valuation Report is an in-depth analysis detailing your home's value as well as a comparison with similar homes in the area
Home Values in the Area
Average Home Value in this Area
Purchase History
| Date | Buyer | Sale Price | Title Company |
|---|---|---|---|
| Our John D | $500 | -- | |
| Our John D | $500 | -- | |
| Our John D | $500 | -- | |
| Our John D | -- | -- | |
| J & B Our Rt | $10,000 | -- | |
| J & B Our Rt | $600,000 | -- | |
| Davenport Rt | $34,000 | -- |
Source: Public Records
Mortgage History
| Date | Status | Borrower | Loan Amount |
|---|---|---|---|
| Previous Owner | J & B Our Rt | $275,000 |
Source: Public Records
Tax History Compared to Growth
Tax History
| Year | Tax Paid | Tax Assessment Tax Assessment Total Assessment is a certain percentage of the fair market value that is determined by local assessors to be the total taxable value of land and additions on the property. | Land | Improvement |
|---|---|---|---|---|
| 2025 | $3,048 | $515,800 | $388,400 | $127,400 |
| 2024 | $3,014 | $499,800 | $373,400 | $126,400 |
| 2023 | $2,681 | $403,700 | $296,300 | $107,400 |
| 2022 | $3,109 | $383,400 | $279,500 | $103,900 |
| 2021 | $3,283 | $381,700 | $277,000 | $104,700 |
| 2020 | $3,330 | $381,400 | $330,400 | $51,000 |
| 2019 | $3,190 | $367,900 | $317,600 | $50,300 |
| 2018 | $3,329 | $367,300 | $317,700 | $49,600 |
| 2017 | $3,154 | $351,600 | $302,400 | $49,200 |
| 2016 | $2,746 | $302,800 | $254,100 | $48,700 |
| 2015 | $2,675 | $298,200 | $249,100 | $49,100 |
| 2014 | $2,555 | $291,300 | $241,900 | $49,400 |
Source: Public Records
Map
Nearby Homes
- 3 Bittersweet Ln
- 2 Bassett Woods Rd
- 3 Bentley Rd
- 12 Old Campground Rd
- 18 Old Campground
- 91 Depot Rd W
- 135 Sisson Rd
- 16 Long Pond Dr
- 159 Pleasant Lake Ave
- 64 Smith St
- 37 Cyprus Rd
- 11 Lane Rd
- 37 Cyprus Rd
- 14 2nd St
- 25 Black Duck Cartway
- 9 Bells Neck Rd Unit 10
- 11 Windjammer Rd
- 9 Mansion St
- 0 Ash Ct
- 360 Center St
- 96 Queen Ann Unit 105
- 101 Queen Anne Rd
- 803 Queen Anne Ct
- 566 Queen Anne Ct
- 96 Queen Anne Ct Unit 101
- 1866 Queen Anne Ct
- 0 Queen Anne Ct
- 94 Queen Anne Rd
- 105 Queen Anne Rd
- 2 King Henry Rd
- 99 Queen Anne Rd
- 109 Queen Anne Rd
- 96 Queen Anne Rd Unit 506
- 96 Queen Anne Rd Unit 505
- 96 Queen Anne Rd Unit 504
- 96 Queen Anne Rd Unit 503
- 96 Queen Anne Rd Unit 502
- 96 Queen Anne Rd Unit 501
- 96 Queen Anne Rd Unit 404
- 96 Queen Anne Rd Unit 403