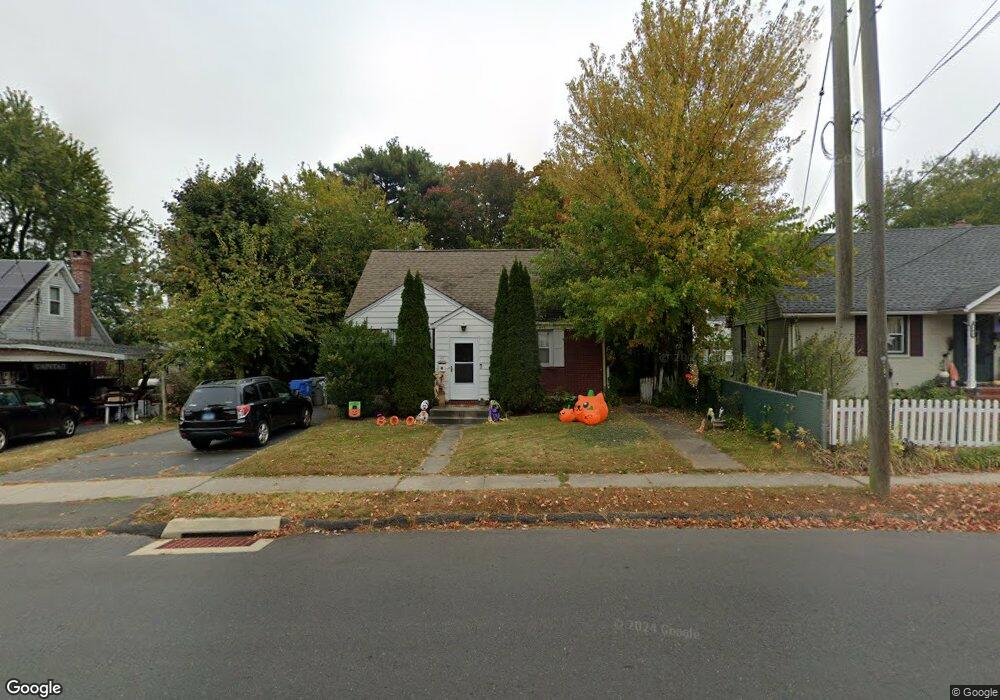
97 Redstone St Bristol, CT 06010
Forestville NeighborhoodEstimated Value: $276,561 - $322,000
3
Beds
1
Bath
984
Sq Ft
$300/Sq Ft
Est. Value
About This Home
This home is located at 97 Redstone St, Bristol, CT 06010 and is currently estimated at $295,390, approximately $300 per square foot. 97 Redstone St is a home located in Hartford County with nearby schools including Bristol Central High School, St Matthew School, and Great Beginnings.
Ownership History
Date
Name
Owned For
Owner Type
Purchase Details
Closed on
Apr 16, 2007
Sold by
Croce David and Stokes Joanne
Bought by
754 Pine Street Llc
Current Estimated Value
Purchase Details
Closed on
May 5, 1994
Sold by
Aj & S Assoc Iii Ltd
Bought by
Cardines Jeffrey M and Cardines Joyce D
Home Financials for this Owner
Home Financials are based on the most recent Mortgage that was taken out on this home.
Original Mortgage
$128,150
Interest Rate
7.7%
Mortgage Type
Unknown
Purchase Details
Closed on
Aug 25, 1993
Sold by
Rose David
Bought by
Christian Act Council
Create a Home Valuation Report for This Property
The Home Valuation Report is an in-depth analysis detailing your home's value as well as a comparison with similar homes in the area
Home Values in the Area
Average Home Value in this Area
Purchase History
| Date | Buyer | Sale Price | Title Company |
|---|---|---|---|
| 754 Pine Street Llc | $165,000 | -- | |
| Cardines Jeffrey M | $134,900 | -- | |
| Christian Act Council | $90,000 | -- |
Source: Public Records
Mortgage History
| Date | Status | Borrower | Loan Amount |
|---|---|---|---|
| Previous Owner | Christian Act Council | $128,150 | |
| Previous Owner | Christian Act Council | $2,850 |
Source: Public Records
Tax History Compared to Growth
Tax History
| Year | Tax Paid | Tax Assessment Tax Assessment Total Assessment is a certain percentage of the fair market value that is determined by local assessors to be the total taxable value of land and additions on the property. | Land | Improvement |
|---|---|---|---|---|
| 2025 | $4,463 | $132,240 | $30,530 | $101,710 |
| 2024 | $4,212 | $132,240 | $30,530 | $101,710 |
| 2023 | $4,013 | $132,240 | $30,530 | $101,710 |
| 2022 | $3,470 | $90,480 | $21,080 | $69,400 |
| 2021 | $3,470 | $90,480 | $21,080 | $69,400 |
| 2020 | $3,470 | $90,480 | $21,080 | $69,400 |
| 2019 | $3,443 | $90,480 | $21,110 | $69,370 |
| 2018 | $3,337 | $90,480 | $21,110 | $69,370 |
| 2017 | $3,240 | $89,920 | $28,670 | $61,250 |
| 2016 | $3,240 | $89,920 | $28,670 | $61,250 |
| 2015 | $3,112 | $89,920 | $28,670 | $61,250 |
| 2014 | $3,112 | $89,920 | $28,670 | $61,250 |
Source: Public Records
Map
Nearby Homes
- 245 W Main St
- 158 E Main St
- 683 Pine St
- 9 Hemingway St
- 49 Lincoln St
- 132 Hollyberry Ln
- 25 Zack Ln
- 418 Washington St
- 26 Skyline Dr
- 61 S Washington St
- 226 Camp St
- 122 W Main St
- 48 Sandstone Rd Unit 48
- 0 Oakwood Cir
- 84 Robertson St Unit 84
- 370 Emmett St Unit 5-5
- 370 Emmett St Unit 5-2
- 370 Emmett St Unit 3-2
- 370 Emmett St Unit 5-3
- 370 Emmett St Unit 5-1