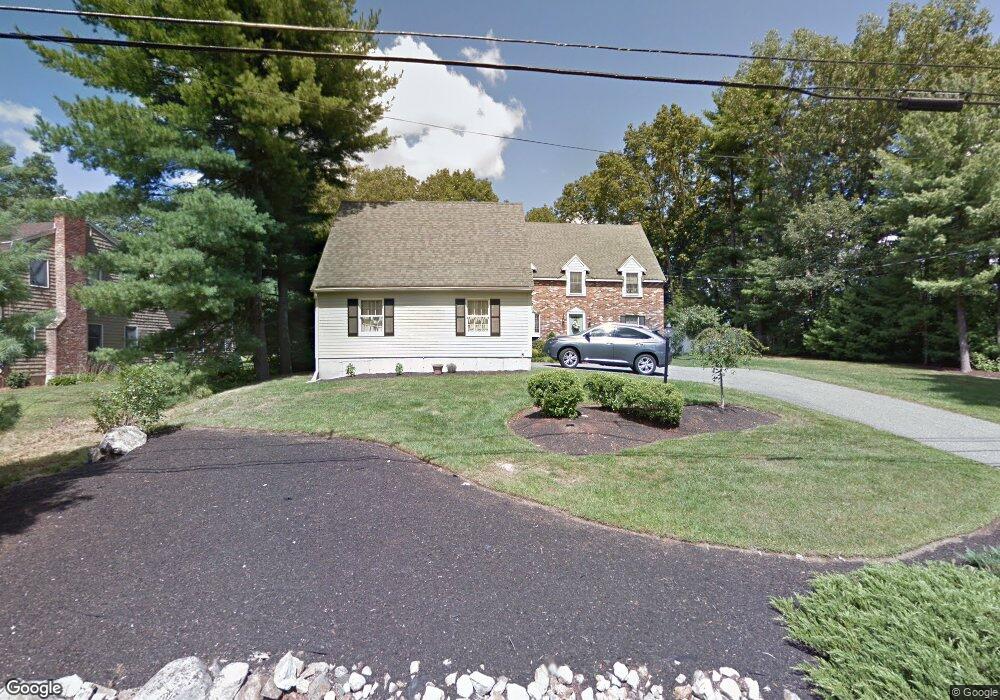
97 Sanborn Ln Reading, MA 01867
Estimated Value: $1,164,123 - $1,300,000
4
Beds
3
Baths
2,290
Sq Ft
$546/Sq Ft
Est. Value
About This Home
This home is located at 97 Sanborn Ln, Reading, MA 01867 and is currently estimated at $1,250,531, approximately $546 per square foot. 97 Sanborn Ln is a home located in Middlesex County with nearby schools including Wood End Elementary School, Arthur W. Coolidge Middle School, and Reading Memorial High School.
Ownership History
Date
Name
Owned For
Owner Type
Purchase Details
Closed on
May 14, 2024
Sold by
Hayes Michael G and Hayes Dorothy M
Bought by
97 Sanborn Lane Nt and Hayes
Current Estimated Value
Purchase Details
Closed on
Oct 29, 1986
Bought by
Hayes Michael G and Hayes Dorothy M
Create a Home Valuation Report for This Property
The Home Valuation Report is an in-depth analysis detailing your home's value as well as a comparison with similar homes in the area
Home Values in the Area
Average Home Value in this Area
Purchase History
| Date | Buyer | Sale Price | Title Company |
|---|---|---|---|
| 97 Sanborn Lane Nt | -- | None Available | |
| 97 Sanborn Lane Nt | -- | None Available | |
| Hayes Michael G | $370,000 | -- |
Source: Public Records
Mortgage History
| Date | Status | Borrower | Loan Amount |
|---|---|---|---|
| Previous Owner | Hayes Michael G | $150,000 | |
| Previous Owner | Hayes Michael G | $160,000 |
Source: Public Records
Tax History Compared to Growth
Tax History
| Year | Tax Paid | Tax Assessment Tax Assessment Total Assessment is a certain percentage of the fair market value that is determined by local assessors to be the total taxable value of land and additions on the property. | Land | Improvement |
|---|---|---|---|---|
| 2025 | $13,095 | $1,149,700 | $596,700 | $553,000 |
| 2024 | $13,256 | $1,131,100 | $587,000 | $544,100 |
| 2023 | $12,479 | $991,200 | $514,200 | $477,000 |
| 2022 | $12,466 | $935,200 | $485,100 | $450,100 |
| 2021 | $11,929 | $863,800 | $443,900 | $419,900 |
| 2020 | $11,460 | $821,500 | $422,100 | $399,400 |
| 2019 | $10,987 | $772,100 | $396,600 | $375,500 |
| 2018 | $10,022 | $722,600 | $371,100 | $351,500 |
| 2017 | $9,940 | $708,500 | $363,800 | $344,700 |
| 2016 | $10,975 | $756,900 | $359,200 | $397,700 |
| 2015 | $10,118 | $688,300 | $326,500 | $361,800 |
| 2014 | $10,146 | $688,300 | $326,500 | $361,800 |
Source: Public Records
Map
Nearby Homes