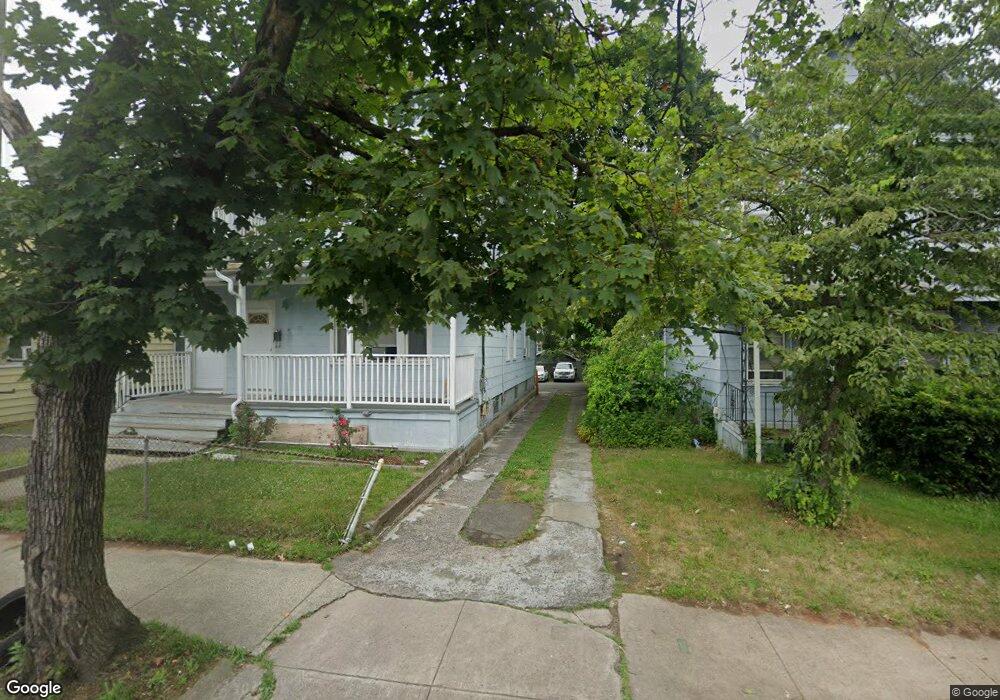
97 Spring St Unit 3 West Haven, CT 06516
Allingtown NeighborhoodEstimated Value: $297,000 - $547,000
5
Beds
3
Baths
2,761
Sq Ft
$154/Sq Ft
Est. Value
About This Home
This home is located at 97 Spring St Unit 3, West Haven, CT 06516 and is currently estimated at $425,159, approximately $153 per square foot. 97 Spring St Unit 3 is a home located in New Haven County with nearby schools including Carrigan 5/6 Intermediate School, Harry M. Bailey Middle School, and West Haven High School.
Ownership History
Date
Name
Owned For
Owner Type
Purchase Details
Closed on
Jan 6, 2025
Sold by
Ceja Roberto
Bought by
Ceja Roberto and Gonzalez Ma G
Current Estimated Value
Purchase Details
Closed on
Aug 3, 2020
Sold by
Ceja Roberto
Bought by
Ceja Roberto
Purchase Details
Closed on
Sep 15, 2003
Sold by
Davis Wayne E and Davis Marsha A
Bought by
Ceja Roberto
Home Financials for this Owner
Home Financials are based on the most recent Mortgage that was taken out on this home.
Original Mortgage
$171,000
Interest Rate
6.22%
Mortgage Type
Purchase Money Mortgage
Purchase Details
Closed on
Feb 25, 1987
Sold by
Bartley William F
Bought by
Davis Wayne E
Create a Home Valuation Report for This Property
The Home Valuation Report is an in-depth analysis detailing your home's value as well as a comparison with similar homes in the area
Home Values in the Area
Average Home Value in this Area
Purchase History
| Date | Buyer | Sale Price | Title Company |
|---|---|---|---|
| Ceja Roberto | -- | None Available | |
| Ceja Roberto | -- | None Available | |
| Ceja Roberto | -- | None Available | |
| Ceja Roberto | -- | None Available | |
| Ceja Roberto | $190,000 | -- | |
| Ceja Roberto | $190,000 | -- | |
| Davis Wayne E | $142,000 | -- |
Source: Public Records
Mortgage History
| Date | Status | Borrower | Loan Amount |
|---|---|---|---|
| Previous Owner | Davis Wayne E | $171,000 | |
| Previous Owner | Davis Wayne E | $107,000 | |
| Previous Owner | Davis Wayne E | $11,000 |
Source: Public Records
Tax History
| Year | Tax Paid | Tax Assessment Tax Assessment Total Assessment is a certain percentage of the fair market value that is determined by local assessors to be the total taxable value of land and additions on the property. | Land | Improvement |
|---|---|---|---|---|
| 2025 | $8,375 | $242,550 | $48,370 | $194,180 |
| 2024 | $7,350 | $151,480 | $33,530 | $117,950 |
| 2023 | $7,045 | $151,480 | $33,530 | $117,950 |
| 2022 | $6,907 | $151,480 | $33,530 | $117,950 |
| 2021 | $6,907 | $151,480 | $33,530 | $117,950 |
| 2020 | $5,152 | $121,310 | $26,180 | $95,130 |
| 2019 | $5,904 | $121,310 | $26,180 | $95,130 |
| 2018 | $4,963 | $121,310 | $26,180 | $95,130 |
| 2017 | $5,539 | $121,310 | $26,180 | $95,130 |
| 2016 | $5,527 | $121,310 | $26,180 | $95,130 |
| 2015 | $5,005 | $124,040 | $31,640 | $92,400 |
| 2014 | $4,974 | $124,040 | $31,640 | $92,400 |
Source: Public Records
Map
Nearby Homes
- 93 Spring St
- 22 Thill St
- 880 First Ave
- 33 Baggott St
- 155 Lamson St
- 21 Richards St
- 267 Front Ave
- 1007 Campbell Ave
- 28 Terrace Ave
- 14 Ely St
- 43 Wharton St
- 194 Ella T Grasso Blvd
- 484 1st Ave Unit 6
- 15 Wallace St
- 677 Washington Ave
- 15 Crest St Unit 27
- 195 Elm St
- 48 Homeside Ave Unit 4
- 161 W Spring St Unit B4
- 111 Morris St
Your Personal Tour Guide
Ask me questions while you tour the home.