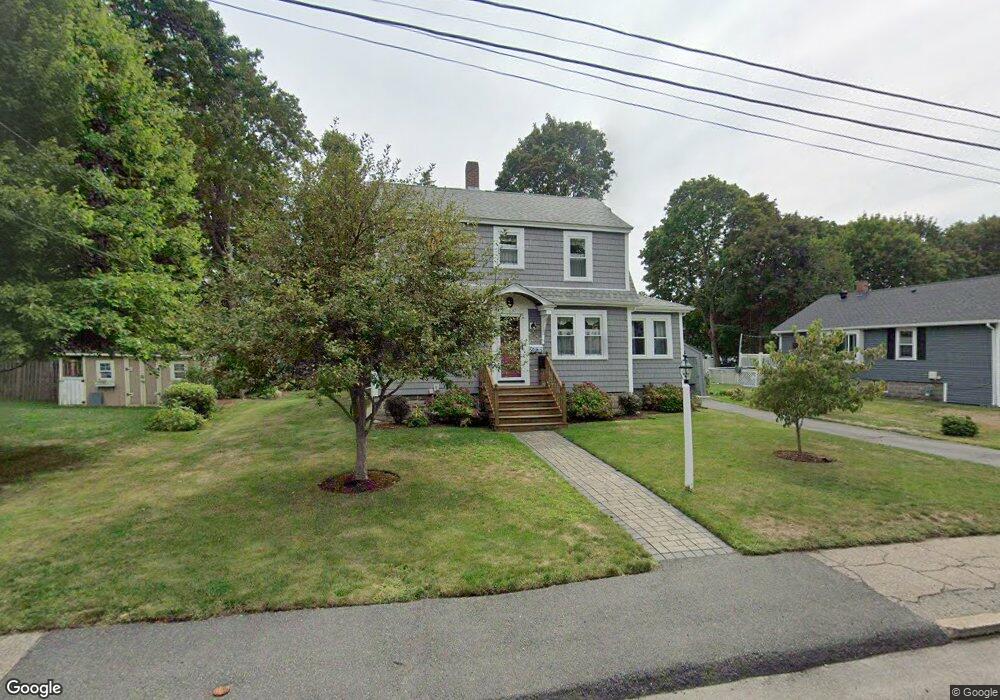
97 Stanton St Rockland, MA 02370
Estimated Value: $529,000 - $601,000
3
Beds
2
Baths
1,532
Sq Ft
$362/Sq Ft
Est. Value
About This Home
This home is located at 97 Stanton St, Rockland, MA 02370 and is currently estimated at $553,948, approximately $361 per square foot. 97 Stanton St is a home located in Plymouth County with nearby schools including Rockland Senior High School, Calvary Chapel Academy, and St Bridget School.
Ownership History
Date
Name
Owned For
Owner Type
Purchase Details
Closed on
Feb 1, 2024
Sold by
Tempesta Gerard J and Tempesta Jeanne E
Bought by
Tempesta
Current Estimated Value
Purchase Details
Closed on
Apr 5, 1984
Bought by
Tempesta Gerard J and Tempesta Jeanne E
Create a Home Valuation Report for This Property
The Home Valuation Report is an in-depth analysis detailing your home's value as well as a comparison with similar homes in the area
Home Values in the Area
Average Home Value in this Area
Purchase History
| Date | Buyer | Sale Price | Title Company |
|---|---|---|---|
| Tempesta | -- | None Available | |
| Tempesta Gerard J | -- | -- |
Source: Public Records
Mortgage History
| Date | Status | Borrower | Loan Amount |
|---|---|---|---|
| Previous Owner | Tempesta Gerard J | $50,000 | |
| Previous Owner | Tempesta Gerard J | $165,000 | |
| Previous Owner | Tempesta Gerard J | $105,000 | |
| Previous Owner | Tempesta Gerard J | $58,000 |
Source: Public Records
Tax History
| Year | Tax Paid | Tax Assessment Tax Assessment Total Assessment is a certain percentage of the fair market value that is determined by local assessors to be the total taxable value of land and additions on the property. | Land | Improvement |
|---|---|---|---|---|
| 2025 | $6,385 | $467,100 | $223,900 | $243,200 |
| 2024 | $6,245 | $444,200 | $211,300 | $232,900 |
| 2023 | $6,059 | $398,100 | $184,100 | $214,000 |
| 2022 | $5,847 | $349,100 | $160,100 | $189,000 |
| 2021 | $5,495 | $318,000 | $145,500 | $172,500 |
| 2020 | $5,175 | $303,000 | $138,600 | $164,400 |
| 2019 | $6,000 | $291,100 | $132,000 | $159,100 |
| 2018 | $4,617 | $270,400 | $132,000 | $138,400 |
| 2017 | $4,646 | $251,200 | $125,100 | $126,100 |
| 2016 | $4,469 | $241,700 | $120,300 | $121,400 |
| 2015 | $4,270 | $224,400 | $112,400 | $112,000 |
| 2014 | $4,040 | $220,300 | $110,200 | $110,100 |
Source: Public Records
Map
Nearby Homes
- 63 Webster St
- 436 E Water St
- 117 Liberty St
- 92 Liberty St
- 98 Myrtle St
- 12 Linden St
- 49 Liberty St
- 48 Bigelow Ave
- 50 Linden Park
- 103 Reed St
- 19 Dyer St Unit 19
- 14 Dyer St Unit 14
- 12 Dyer St Unit 12
- 215 Market St
- 9 Old Market St
- 40 Summit St
- 103 Grove St Unit 349
- 103 Grove St Unit 317
- 206-208 Hinghm St
- 1 Canterbury Ln
Your Personal Tour Guide
Ask me questions while you tour the home.