Estimated Value: $747,988 - $1,084,000
3
Beds
1
Bath
1,500
Sq Ft
$614/Sq Ft
Est. Value
About This Home
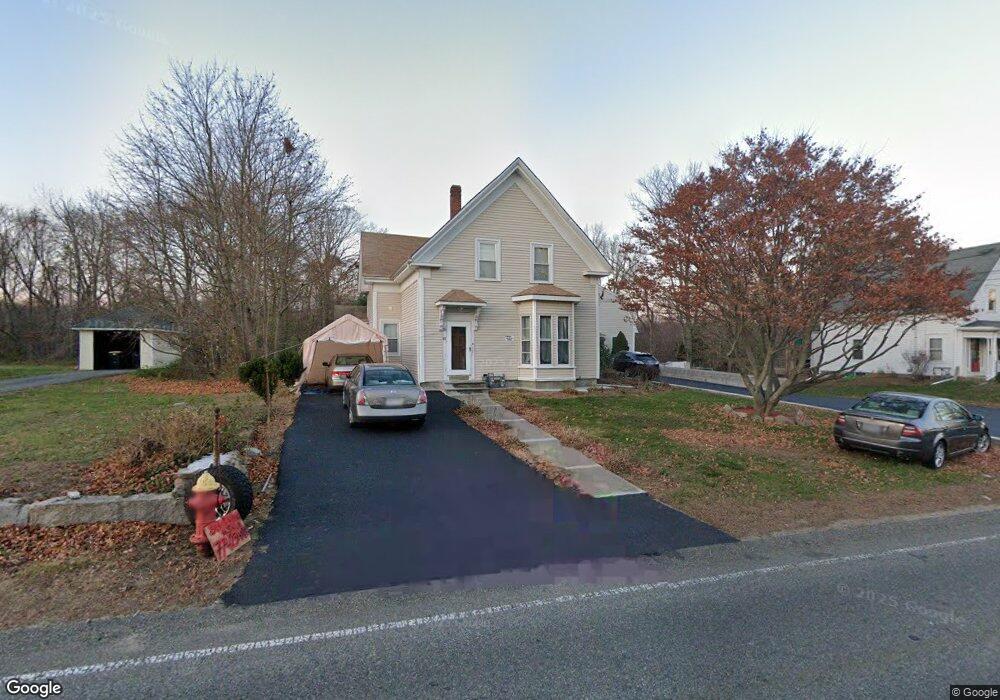
This home is located at 97 W High St Unit 2, Avon, MA 02322 and is currently estimated at $921,747, approximately $614 per square foot. 97 W High St Unit 2 is a home located in Norfolk County with nearby schools including Ralph D. Butler Elementary School, Avon Middle/High School, and Lighthouse Baptist Christian Academy.
Ownership History
Date
Name
Owned For
Owner Type
Purchase Details
Closed on
Jul 5, 2012
Sold by
Depesa Michael and Depesa Sara N
Bought by
Oliveira Graciano M and Oliveira Lucia A
Current Estimated Value
Home Financials for this Owner
Home Financials are based on the most recent Mortgage that was taken out on this home.
Original Mortgage
$397,664
Outstanding Balance
$275,927
Interest Rate
3.78%
Mortgage Type
New Conventional
Estimated Equity
$645,820
Create a Home Valuation Report for This Property
The Home Valuation Report is an in-depth analysis detailing your home's value as well as a comparison with similar homes in the area
Home Values in the Area
Average Home Value in this Area
Purchase History
| Date | Buyer | Sale Price | Title Company |
|---|---|---|---|
| Oliveira Graciano M | $405,000 | -- |
Source: Public Records
Mortgage History
| Date | Status | Borrower | Loan Amount |
|---|---|---|---|
| Open | Oliveira Graciano M | $397,664 |
Source: Public Records
Tax History Compared to Growth
Tax History
| Year | Tax Paid | Tax Assessment Tax Assessment Total Assessment is a certain percentage of the fair market value that is determined by local assessors to be the total taxable value of land and additions on the property. | Land | Improvement |
|---|---|---|---|---|
| 2025 | $82 | $613,900 | $216,600 | $397,300 |
| 2024 | $8,574 | $611,100 | $210,500 | $400,600 |
| 2023 | $8,323 | $611,100 | $210,500 | $400,600 |
| 2022 | $7,472 | $472,600 | $176,100 | $296,500 |
| 2021 | $6,853 | $408,400 | $159,900 | $248,500 |
| 2020 | $7,576 | $428,000 | $156,900 | $271,100 |
| 2019 | $7,802 | $433,700 | $156,900 | $276,800 |
| 2018 | $8,045 | $433,700 | $156,900 | $276,800 |
| 2017 | $7,500 | $434,000 | $156,900 | $277,100 |
| 2016 | $6,926 | $404,800 | $156,900 | $247,900 |
| 2015 | $6,399 | $390,900 | $143,000 | $247,900 |
Source: Public Records
Map
Nearby Homes