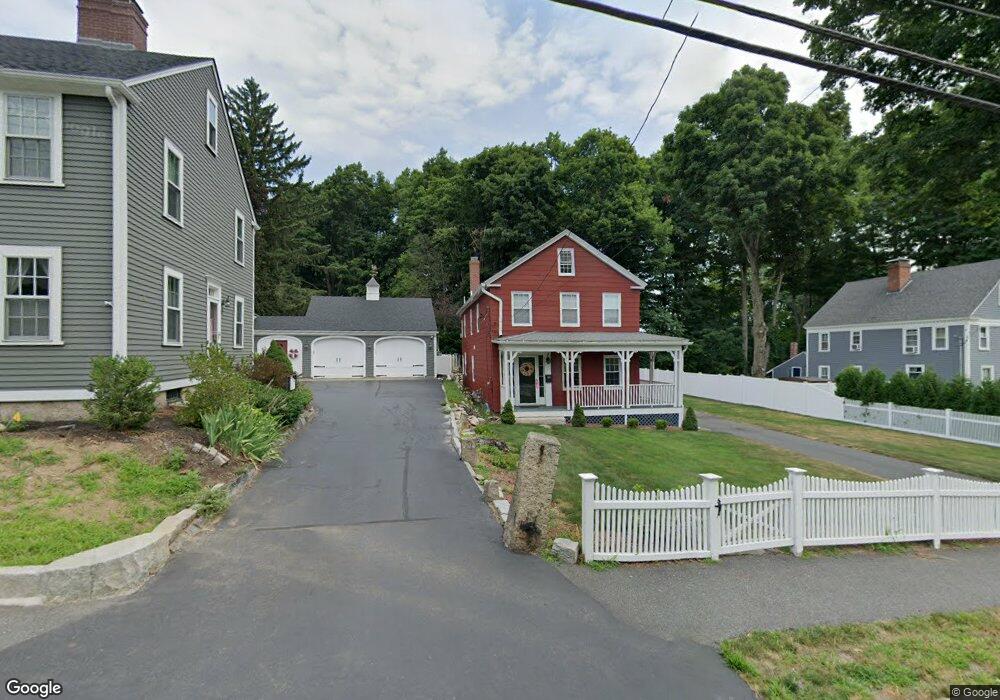
97 W Main St Westborough, MA 01581
Estimated Value: $701,747 - $821,000
3
Beds
2
Baths
2,096
Sq Ft
$353/Sq Ft
Est. Value
About This Home
This home is located at 97 W Main St, Westborough, MA 01581 and is currently estimated at $738,937, approximately $352 per square foot. 97 W Main St is a home located in Worcester County with nearby schools including Westborough High School, Ebridge Montessori School, and Westboro Knowledge Beginnings.
Ownership History
Date
Name
Owned For
Owner Type
Purchase Details
Closed on
Jul 27, 2005
Sold by
Johnson Kurt W and Johnson Stacia O
Bought by
Kelly Julie A and Kelly William T
Current Estimated Value
Home Financials for this Owner
Home Financials are based on the most recent Mortgage that was taken out on this home.
Original Mortgage
$255,000
Outstanding Balance
$134,041
Interest Rate
5.67%
Mortgage Type
Purchase Money Mortgage
Estimated Equity
$604,896
Create a Home Valuation Report for This Property
The Home Valuation Report is an in-depth analysis detailing your home's value as well as a comparison with similar homes in the area
Home Values in the Area
Average Home Value in this Area
Purchase History
| Date | Buyer | Sale Price | Title Company |
|---|---|---|---|
| Kelly Julie A | $405,000 | -- |
Source: Public Records
Mortgage History
| Date | Status | Borrower | Loan Amount |
|---|---|---|---|
| Open | Kelly Julie A | $255,000 |
Source: Public Records
Tax History Compared to Growth
Tax History
| Year | Tax Paid | Tax Assessment Tax Assessment Total Assessment is a certain percentage of the fair market value that is determined by local assessors to be the total taxable value of land and additions on the property. | Land | Improvement |
|---|---|---|---|---|
| 2025 | $8,839 | $542,600 | $301,300 | $241,300 |
| 2024 | $8,315 | $506,700 | $280,200 | $226,500 |
| 2023 | $7,930 | $470,900 | $265,600 | $205,300 |
| 2022 | $7,296 | $394,600 | $211,100 | $183,500 |
| 2021 | $3,930 | $371,600 | $188,100 | $183,500 |
| 2020 | $1,802 | $373,800 | $195,800 | $178,000 |
| 2019 | $7,099 | $387,300 | $195,800 | $191,500 |
| 2018 | $6,201 | $335,900 | $182,300 | $153,600 |
| 2017 | $5,979 | $335,900 | $182,300 | $153,600 |
| 2016 | $5,750 | $323,600 | $172,700 | $150,900 |
| 2015 | $5,960 | $320,600 | $172,700 | $147,900 |
Source: Public Records
Map
Nearby Homes
- 7 Jennings Rd
- 6 Folly Ln
- 43 Church St
- 56 Ruggles St
- 19 Fisher St
- 21 South St Unit 31
- 15 Beach St
- 48 High Street Extension
- 16 Ward Ln
- 23 Water St
- 192 W Main St
- 14 Mayberry Dr Unit 10
- 4 Upton Rd
- 22 Treetop Park
- 9 Treetop Park
- 19 Treetop Park Unit 19
- 39 Warren St
- 30 Old Nourse St
- 9 Shaker Way
- 3 Dover Way