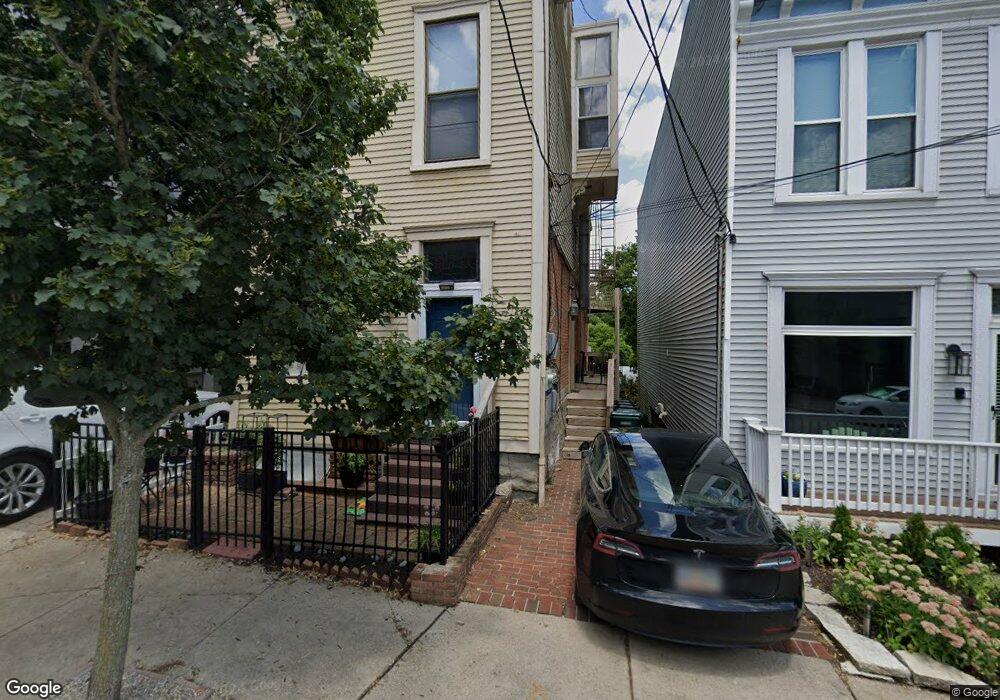
970 Hatch St Unit 3 Cincinnati, OH 45202
Mount Adams NeighborhoodEstimated Value: $309,000 - $406,000
2
Beds
2
Baths
1,388
Sq Ft
$251/Sq Ft
Est. Value
About This Home
This home is located at 970 Hatch St Unit 3, Cincinnati, OH 45202 and is currently estimated at $348,886, approximately $251 per square foot. 970 Hatch St Unit 3 is a home located in Hamilton County with nearby schools including Robert A. Taft Information Technology High School, Withrow University High School, and Clark Montessori High School.
Ownership History
Date
Name
Owned For
Owner Type
Purchase Details
Closed on
Aug 1, 2012
Sold by
Staples Thomas Michael
Bought by
Christensen Michael
Current Estimated Value
Home Financials for this Owner
Home Financials are based on the most recent Mortgage that was taken out on this home.
Original Mortgage
$169,600
Outstanding Balance
$116,120
Interest Rate
3.65%
Mortgage Type
Purchase Money Mortgage
Estimated Equity
$232,766
Purchase Details
Closed on
Nov 28, 2007
Sold by
Garland Patrick J
Bought by
Oneill Rita and The Vera Staples Revocable Living Trust
Purchase Details
Closed on
Nov 4, 1996
Sold by
Garland Patrick James and Garland Mary Elizabeth
Bought by
Garland Patrick James and Garland Mary Elizabeth
Purchase Details
Closed on
Mar 29, 1996
Sold by
Colliopoulos John A
Bought by
Garland Patrick J
Home Financials for this Owner
Home Financials are based on the most recent Mortgage that was taken out on this home.
Original Mortgage
$132,200
Interest Rate
6.98%
Create a Home Valuation Report for This Property
The Home Valuation Report is an in-depth analysis detailing your home's value as well as a comparison with similar homes in the area
Home Values in the Area
Average Home Value in this Area
Purchase History
| Date | Buyer | Sale Price | Title Company |
|---|---|---|---|
| Christensen Michael | $212,000 | Attorney | |
| Oneill Rita | $278,000 | Attorney | |
| Garland Patrick James | -- | -- | |
| Garland Patrick J | $146,900 | -- |
Source: Public Records
Mortgage History
| Date | Status | Borrower | Loan Amount |
|---|---|---|---|
| Open | Christensen Michael | $169,600 | |
| Previous Owner | Garland Patrick J | $132,200 |
Source: Public Records
Tax History Compared to Growth
Tax History
| Year | Tax Paid | Tax Assessment Tax Assessment Total Assessment is a certain percentage of the fair market value that is determined by local assessors to be the total taxable value of land and additions on the property. | Land | Improvement |
|---|---|---|---|---|
| 2024 | $4,684 | $78,586 | $31,500 | $47,086 |
| 2023 | $4,790 | $78,586 | $31,500 | $47,086 |
| 2022 | $5,325 | $78,407 | $31,500 | $46,907 |
| 2021 | $5,130 | $78,407 | $31,500 | $46,907 |
| 2020 | $5,281 | $78,407 | $31,500 | $46,907 |
| 2019 | $5,772 | $78,407 | $31,500 | $46,907 |
| 2018 | $5,781 | $78,407 | $31,500 | $46,907 |
| 2017 | $5,493 | $78,407 | $31,500 | $46,907 |
| 2016 | $5,272 | $74,200 | $31,185 | $43,015 |
| 2015 | $4,752 | $74,200 | $31,185 | $43,015 |
| 2014 | $4,786 | $74,200 | $31,185 | $43,015 |
| 2013 | $5,053 | $77,000 | $31,500 | $45,500 |
Source: Public Records
Map
Nearby Homes
- 961 Hatch St
- 1136 Carney St
- 1000 Paradrome St
- 1112 Fuller St
- 1109 Fuller St
- 1026 Hatch St
- 1040 Hatch St Unit 11
- 955 Pavilion St
- 913 Paradrome St
- 1054 Saint Paul Place
- 1238 Elsinore Ave
- 1240 Elsinore Ave
- 953 Hill St
- 330 Oregon St
- 341 Oregon St
- 327 Oregon St
- 325 Oregon St
- 310 Oregon St
- 328 Oregon St
- 397 Oregon St
- 970 Hatch St
- 970 Hatch St Unit 1
- 970 Hatch St Unit 2
- 968 Hatch St
- 972 Hatch St
- 974 Hatch St
- 966 Hatch St
- 976 Hatch St
- 964 Hatch St
- 978 Hatch St
- 962 Hatch St
- 979 Hatch St
- 982 Hatch St
- 982 Hatch St
- 982 Hatch St Unit Mt Adams 1 Bedroom
- 982 Hatch St Unit 2
- 960 Hatch St
- 981 Paradrome St Unit 4
- 981 Paradrome St Unit 2
- 981 Paradrome St Unit A