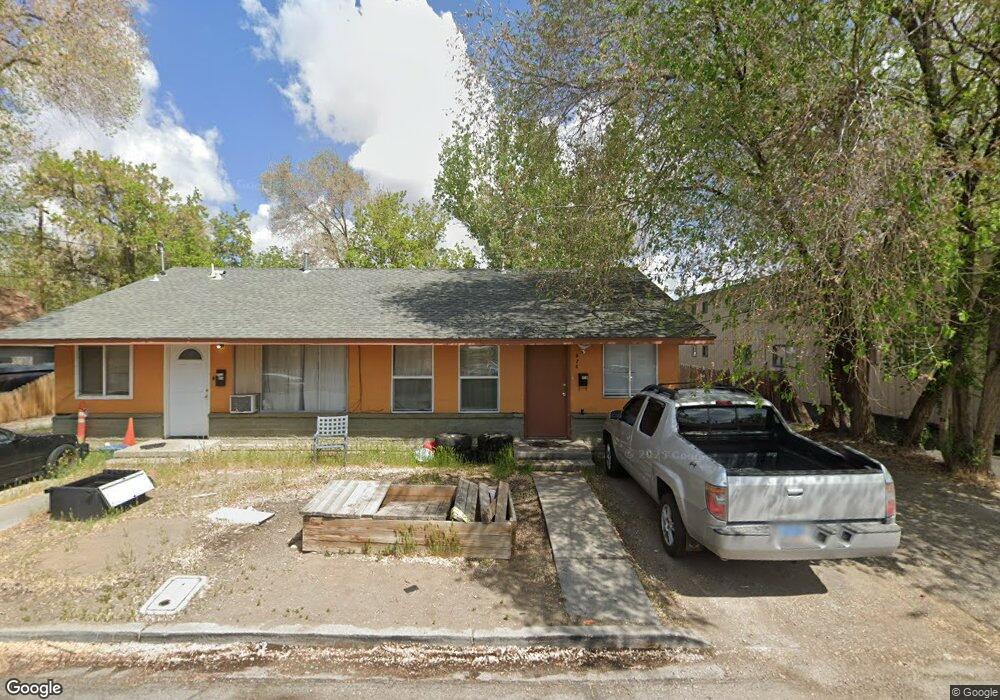
970 I St Sparks, NV 89431
Downtown Sparks NeighborhoodEstimated Value: $414,269 - $571,000
4
Beds
4
Baths
1,896
Sq Ft
$272/Sq Ft
Est. Value
About This Home
This home is located at 970 I St, Sparks, NV 89431 and is currently estimated at $515,317, approximately $271 per square foot. 970 I St is a home located in Washoe County with nearby schools including Robert Mitchell Elementary School, Sparks Middle School, and Sparks High School.
Ownership History
Date
Name
Owned For
Owner Type
Purchase Details
Closed on
Mar 9, 2016
Sold by
Jewk Homes Llc
Bought by
Ishii Herbert I and Zeng Ping J
Current Estimated Value
Purchase Details
Closed on
Sep 6, 2006
Sold by
Marler Eileen M
Bought by
Jewk Homes Llc
Purchase Details
Closed on
Oct 28, 2004
Sold by
Juillerat Hector and Juillerat Helena
Bought by
Marler Eileen M
Home Financials for this Owner
Home Financials are based on the most recent Mortgage that was taken out on this home.
Original Mortgage
$188,500
Interest Rate
5.79%
Mortgage Type
Unknown
Create a Home Valuation Report for This Property
The Home Valuation Report is an in-depth analysis detailing your home's value as well as a comparison with similar homes in the area
Home Values in the Area
Average Home Value in this Area
Purchase History
| Date | Buyer | Sale Price | Title Company |
|---|---|---|---|
| Ishii Herbert I | $261,000 | First Centennial Reno | |
| Jewk Homes Llc | -- | None Available | |
| Marler Eileen M | $283,500 | Stewart Title Of Northern Nv |
Source: Public Records
Mortgage History
| Date | Status | Borrower | Loan Amount |
|---|---|---|---|
| Previous Owner | Marler Eileen M | $188,500 |
Source: Public Records
Tax History
| Year | Tax Paid | Tax Assessment Tax Assessment Total Assessment is a certain percentage of the fair market value that is determined by local assessors to be the total taxable value of land and additions on the property. | Land | Improvement |
|---|---|---|---|---|
| 2026 | -- | $71,813 | $51,450 | $20,363 |
| 2024 | $1,114 | $68,122 | $47,885 | $20,236 |
| 2023 | $1,081 | $66,097 | $48,620 | $17,477 |
| 2022 | $1,051 | $51,838 | $37,030 | $14,808 |
| 2021 | $1,021 | $48,052 | $33,530 | $14,522 |
| 2020 | $989 | $46,525 | $32,200 | $14,325 |
| 2019 | $944 | $41,586 | $28,000 | $13,586 |
| 2018 | $916 | $37,799 | $24,780 | $13,019 |
| 2017 | $889 | $36,478 | $23,800 | $12,678 |
| 2016 | $866 | $32,261 | $19,600 | $12,661 |
| 2015 | $437 | $27,510 | $14,840 | $12,670 |
| 2014 | $842 | $24,404 | $12,600 | $11,804 |
| 2013 | -- | $22,348 | $10,500 | $11,848 |
Source: Public Records
Map
Nearby Homes
Your Personal Tour Guide
Ask me questions while you tour the home.