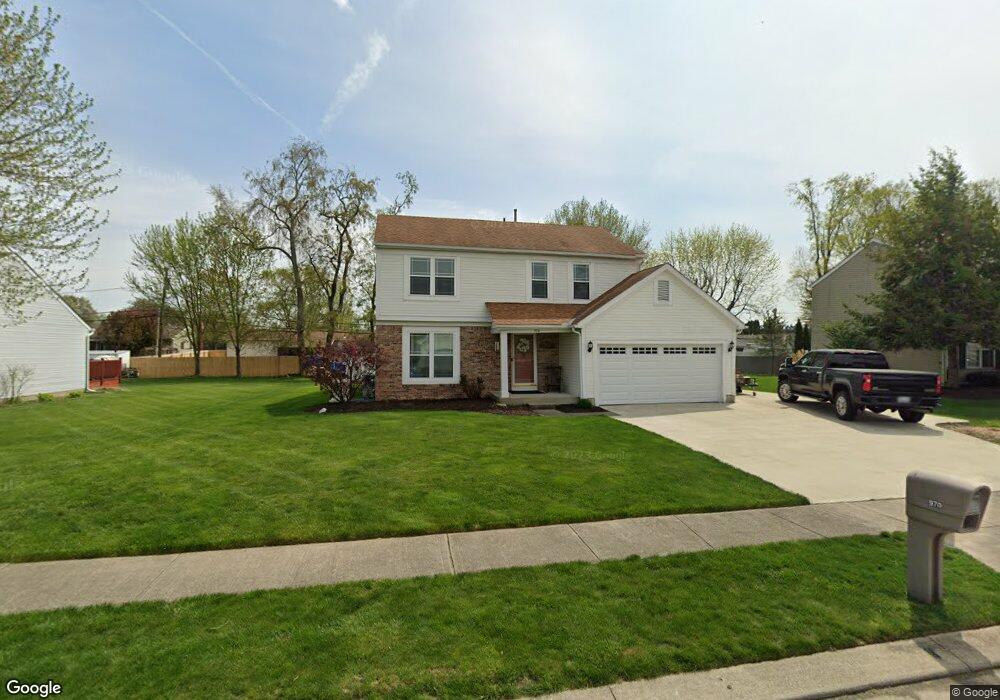
970 Lateglow Ct Newark, OH 43055
Estimated Value: $316,365 - $342,000
4
Beds
3
Baths
1,687
Sq Ft
$196/Sq Ft
Est. Value
About This Home
This home is located at 970 Lateglow Ct, Newark, OH 43055 and is currently estimated at $330,841, approximately $196 per square foot. 970 Lateglow Ct is a home located in Licking County with nearby schools including Legend Elementary School, Liberty Middle School, and Newark High School.
Ownership History
Date
Name
Owned For
Owner Type
Purchase Details
Closed on
Jun 26, 2010
Sold by
Meyer Darla J and Meyer Michael A
Bought by
Meyer Darla J and Meyer Michael A
Current Estimated Value
Home Financials for this Owner
Home Financials are based on the most recent Mortgage that was taken out on this home.
Original Mortgage
$123,200
Outstanding Balance
$82,072
Interest Rate
4.77%
Mortgage Type
New Conventional
Estimated Equity
$248,769
Purchase Details
Closed on
May 10, 2005
Sold by
Todd Mike C
Bought by
Todd Darla J
Purchase Details
Closed on
Sep 17, 2002
Sold by
Franks Robert L
Bought by
Todd Mike C and Todd Darla J
Purchase Details
Closed on
Sep 5, 1996
Sold by
Sovereign Dev Corp
Bought by
Franks Robert L and Franks Christina L
Home Financials for this Owner
Home Financials are based on the most recent Mortgage that was taken out on this home.
Original Mortgage
$115,695
Interest Rate
8.27%
Mortgage Type
FHA
Purchase Details
Closed on
May 14, 1996
Sold by
Owen Potato Farm Inc
Bought by
Sovereign Dev Co
Create a Home Valuation Report for This Property
The Home Valuation Report is an in-depth analysis detailing your home's value as well as a comparison with similar homes in the area
Home Values in the Area
Average Home Value in this Area
Purchase History
| Date | Buyer | Sale Price | Title Company |
|---|---|---|---|
| Meyer Darla J | -- | Park Title | |
| Todd Darla J | -- | -- | |
| Todd Mike C | $131,885 | -- | |
| Franks Robert L | $118,525 | -- | |
| Sovereign Dev Co | $19,500 | -- |
Source: Public Records
Mortgage History
| Date | Status | Borrower | Loan Amount |
|---|---|---|---|
| Open | Meyer Darla J | $123,200 | |
| Previous Owner | Franks Robert L | $115,695 | |
| Closed | Todd Mike C | -- |
Source: Public Records
Tax History Compared to Growth
Tax History
| Year | Tax Paid | Tax Assessment Tax Assessment Total Assessment is a certain percentage of the fair market value that is determined by local assessors to be the total taxable value of land and additions on the property. | Land | Improvement |
|---|---|---|---|---|
| 2024 | $2,903 | $81,210 | $25,170 | $56,040 |
| 2023 | $4,326 | $81,210 | $25,170 | $56,040 |
| 2022 | $2,242 | $55,930 | $14,700 | $41,230 |
| 2021 | $2,352 | $55,930 | $14,700 | $41,230 |
| 2020 | $2,410 | $55,930 | $14,700 | $41,230 |
| 2019 | $2,278 | $51,030 | $9,800 | $41,230 |
| 2018 | $2,280 | $0 | $0 | $0 |
| 2017 | $2,152 | $0 | $0 | $0 |
| 2016 | $2,076 | $0 | $0 | $0 |
| 2015 | $2,121 | $0 | $0 | $0 |
| 2014 | $2,717 | $0 | $0 | $0 |
| 2013 | $2,239 | $0 | $0 | $0 |
Source: Public Records
Map
Nearby Homes
- 913 Roosevelt Ct
- 1006 Kingsbury Ct Unit 1006
- 584 Moull St Unit A
- 712 Stone Ridge Way
- 473 Meadowbrook Dr
- 440 Reverie Place
- 855 E Village Dr
- 711 Sherwick Rd
- 188 Meadow Dr
- 184 Meadow Dr
- 709 Meadow Dr
- 632 Granville Rd
- 565 Granville St
- 979 Granville Rd
- 245 Rugg Ave
- 227 N Quentin Rd
- 189 N Quentin Rd
- 181 S Quentin Rd
- 425 N 11th St
- 408 Granville St
- 962 Lateglow Ct
- 978 Lateglow Ct
- 967 Adams Ave
- 973 Adams Ave
- 957 Adams Ave
- 954 Lateglow Ct
- 997 Lateglow Ct
- 961 Late Glow Ct
- 981 Adams Ave
- 971 Lateglow Ct
- 986 Lateglow Ct
- 961 Lateglow Ct
- 949 Adams Ave
- 989 Adams Ave
- 1005 Late Glow Ct
- 951 Lateglow Ct
- 946 Lateglow Ct
- 943 Adams Ave
- 1005 Lateglow Ct
- 994 Lateglow Ct