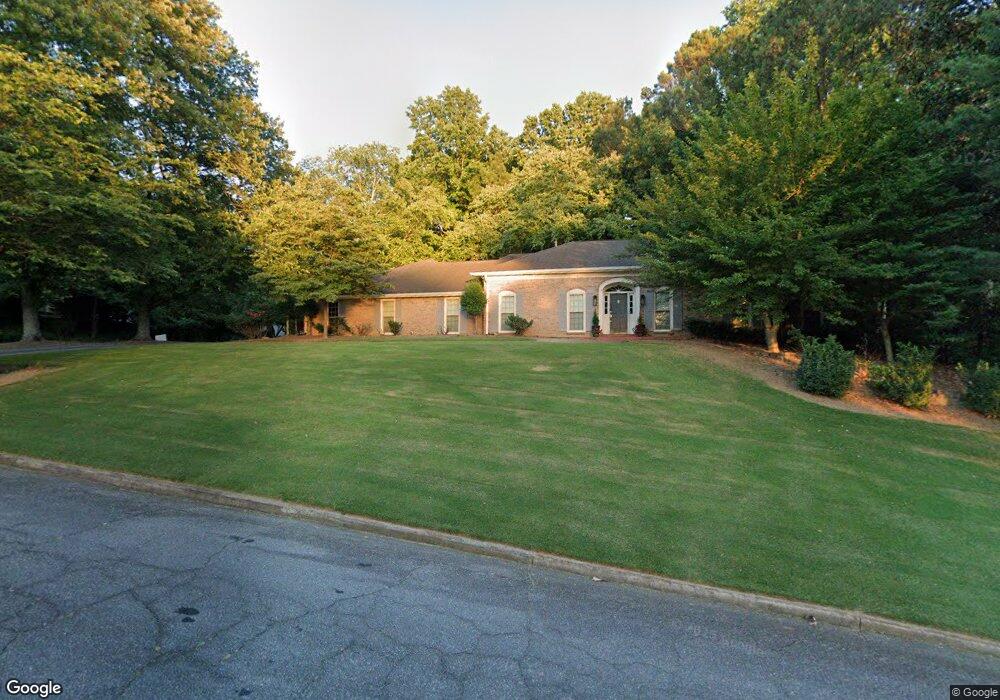
970 Oakhaven Dr Unit 5A Roswell, GA 30075
Brookfield West NeighborhoodEstimated Value: $762,000 - $922,741
4
Beds
4
Baths
3,585
Sq Ft
$239/Sq Ft
Est. Value
About This Home
This home is located at 970 Oakhaven Dr Unit 5A, Roswell, GA 30075 and is currently estimated at $855,685, approximately $238 per square foot. 970 Oakhaven Dr Unit 5A is a home located in Fulton County with nearby schools including Mountain Park Elementary School, Crabapple Middle School, and Fellowship Christian School.
Ownership History
Date
Name
Owned For
Owner Type
Purchase Details
Closed on
May 19, 2006
Sold by
Wilson Joe A and Wilson Susan D
Bought by
Cook Gary D and Cook Janet B
Current Estimated Value
Home Financials for this Owner
Home Financials are based on the most recent Mortgage that was taken out on this home.
Original Mortgage
$295,200
Outstanding Balance
$170,870
Interest Rate
6.39%
Mortgage Type
New Conventional
Estimated Equity
$684,815
Purchase Details
Closed on
Dec 17, 1997
Sold by
Melzow Ward W and Melzow Sally
Bought by
Wilson Joe A and Wilson Susan D
Home Financials for this Owner
Home Financials are based on the most recent Mortgage that was taken out on this home.
Original Mortgage
$169,600
Interest Rate
9.37%
Mortgage Type
New Conventional
Create a Home Valuation Report for This Property
The Home Valuation Report is an in-depth analysis detailing your home's value as well as a comparison with similar homes in the area
Home Values in the Area
Average Home Value in this Area
Purchase History
| Date | Buyer | Sale Price | Title Company |
|---|---|---|---|
| Cook Gary D | $369,000 | -- | |
| Wilson Joe A | $212,000 | -- |
Source: Public Records
Mortgage History
| Date | Status | Borrower | Loan Amount |
|---|---|---|---|
| Open | Cook Gary D | $295,200 | |
| Previous Owner | Wilson Joe A | $169,600 |
Source: Public Records
Tax History Compared to Growth
Tax History
| Year | Tax Paid | Tax Assessment Tax Assessment Total Assessment is a certain percentage of the fair market value that is determined by local assessors to be the total taxable value of land and additions on the property. | Land | Improvement |
|---|---|---|---|---|
| 2025 | $1,002 | $301,520 | $60,400 | $241,120 |
| 2023 | $7,265 | $257,400 | $53,680 | $203,720 |
| 2022 | $4,126 | $210,680 | $52,160 | $158,520 |
| 2021 | $4,887 | $179,920 | $45,280 | $134,640 |
| 2020 | $4,961 | $182,800 | $66,120 | $116,680 |
| 2019 | $796 | $187,000 | $56,560 | $130,440 |
| 2018 | $4,508 | $182,640 | $55,240 | $127,400 |
| 2017 | $4,075 | $152,800 | $33,240 | $119,560 |
| 2016 | $4,054 | $152,800 | $33,240 | $119,560 |
| 2015 | $4,902 | $152,800 | $33,240 | $119,560 |
| 2014 | $3,572 | $129,280 | $28,960 | $100,320 |
Source: Public Records
Map
Nearby Homes
- 870 Hickory Oak Hollow
- 865 Ferncroft Ct
- 680 Brookfield Pkwy Unit 1
- 120 Cedarwood Ln
- 140 Cedarwood Ln
- 12620 Old Surrey Place
- 130 Cedarwood Ln
- 160 Cedarwood Ln
- 5045 Rockingham Dr
- 150 Cedarwood Ln
- 235 Winterberry Way
- 180 Cedarwood Ln
- 4010 Rockingham Dr
- 125 Fortuna Ct
- 570 Wheatridge Bluff
- 515 Kent Rd
- 1005 Hedgerose Ln
- 1460 Lakemist Ct
- 105 Kensington Pond Ct
- 140 E Lake Dr
- 980 Oakhaven Dr
- 910 Brookfield Pkwy
- 945 Brookfield Pkwy Unit 5A
- 975 Oakhaven Dr
- 965 Oakhaven Dr
- 985 Oakhaven Dr Unit 5A
- 990 Oakhaven Dr
- 935 Brookfield Pkwy
- 130 Vistacrest Way
- 900 Brookfield Pkwy Unit 10
- 925 Brookfield Pkwy Unit 10
- 955 Oakhaven Dr
- 995 Oakhaven Dr
- 915 Brookfield Pkwy Unit 10
- 950 Oakhaven Dr
- 1000 Oakhaven Dr
- 945 Oakhaven Dr
- 905 Brookfield Pkwy Unit 10
- 120 Vistacrest Way
- 890 Brookfield Pkwy