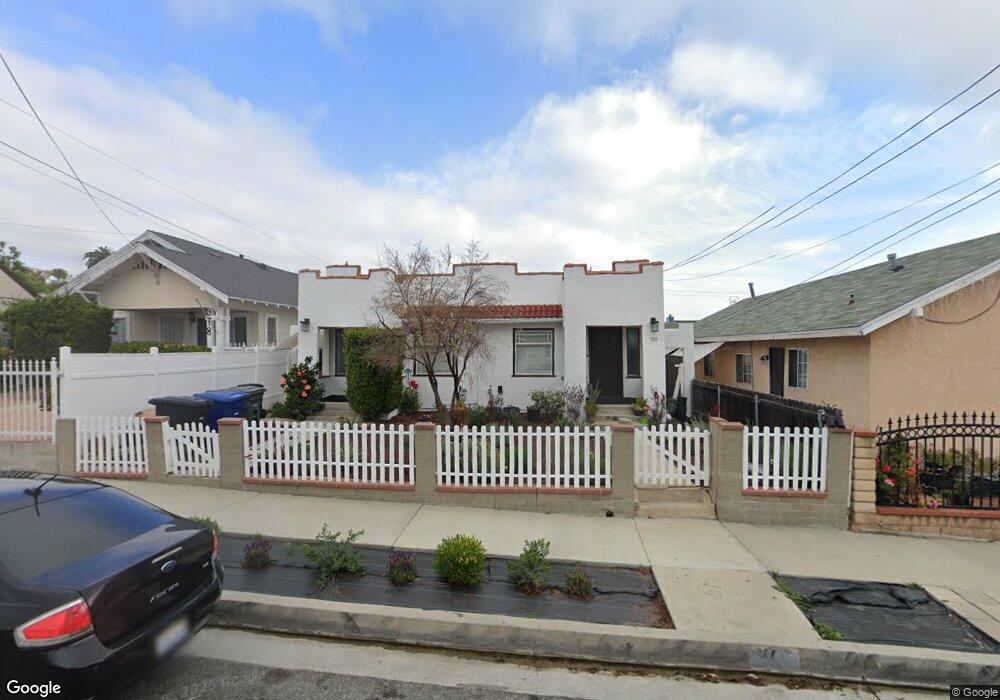
970 W 3rd St San Pedro, CA 90731
Estimated Value: $623,000 - $760,958
2
Beds
2
Baths
1,230
Sq Ft
$559/Sq Ft
Est. Value
About This Home
This home is located at 970 W 3rd St, San Pedro, CA 90731 and is currently estimated at $687,240, approximately $558 per square foot. 970 W 3rd St is a home located in Los Angeles County with nearby schools including Cabrillo Avenue Elementary School, Dana Middle School, and San Pedro Senior High School.
Ownership History
Date
Name
Owned For
Owner Type
Purchase Details
Closed on
May 8, 2024
Sold by
Dora Jane Honeycutt Trust and Successsor Joanne Honeycutt
Bought by
Camacho Jorge
Current Estimated Value
Home Financials for this Owner
Home Financials are based on the most recent Mortgage that was taken out on this home.
Original Mortgage
$508,000
Outstanding Balance
$500,795
Interest Rate
6.82%
Mortgage Type
New Conventional
Estimated Equity
$186,445
Purchase Details
Closed on
May 3, 2011
Sold by
Honeycutt Dora Jane
Bought by
Honeycutt Dora Jane and Dora Jane Honeycutt Trust
Create a Home Valuation Report for This Property
The Home Valuation Report is an in-depth analysis detailing your home's value as well as a comparison with similar homes in the area
Home Values in the Area
Average Home Value in this Area
Purchase History
| Date | Buyer | Sale Price | Title Company |
|---|---|---|---|
| Camacho Jorge | $635,000 | Fidelity National Title | |
| Honeycutt Dora Jane | -- | None Available |
Source: Public Records
Mortgage History
| Date | Status | Borrower | Loan Amount |
|---|---|---|---|
| Open | Camacho Jorge | $508,000 |
Source: Public Records
Tax History
| Year | Tax Paid | Tax Assessment Tax Assessment Total Assessment is a certain percentage of the fair market value that is determined by local assessors to be the total taxable value of land and additions on the property. | Land | Improvement |
|---|---|---|---|---|
| 2025 | $1,215 | $647,700 | $418,200 | $229,500 |
| 2024 | $1,215 | $42,952 | $23,757 | $19,195 |
| 2023 | $1,031 | $42,111 | $23,292 | $18,819 |
| 2022 | $997 | $41,286 | $22,836 | $18,450 |
| 2021 | $981 | $40,478 | $22,389 | $18,089 |
| 2019 | $959 | $39,279 | $21,726 | $17,553 |
| 2018 | $896 | $38,509 | $21,300 | $17,209 |
| 2016 | $849 | $37,016 | $20,474 | $16,542 |
| 2015 | $841 | $36,461 | $20,167 | $16,294 |
| 2014 | $855 | $35,747 | $19,772 | $15,975 |
Source: Public Records
Map
Nearby Homes
- 977 W 2nd St
- 989 W 2nd St
- 1041 W 1st St
- 875 W 1st St
- 1184 W 3rd St
- 514 Arcadia Dr
- 243 S Hanford Ave
- 510 Bellmarin Dr
- 944 W Sepulveda St
- 927 W 6th St
- 784 W 1st St
- 153 N Hanford Ave
- 884 W Sepulveda St
- 739 W 2nd St
- 981 W Oliver St
- 1233 Big Canyon Place
- 404 N Hanford Ave
- 730 W 5th St
- 876 W Oliver St
- 1176 W 7th St Unit 4
Your Personal Tour Guide
Ask me questions while you tour the home.