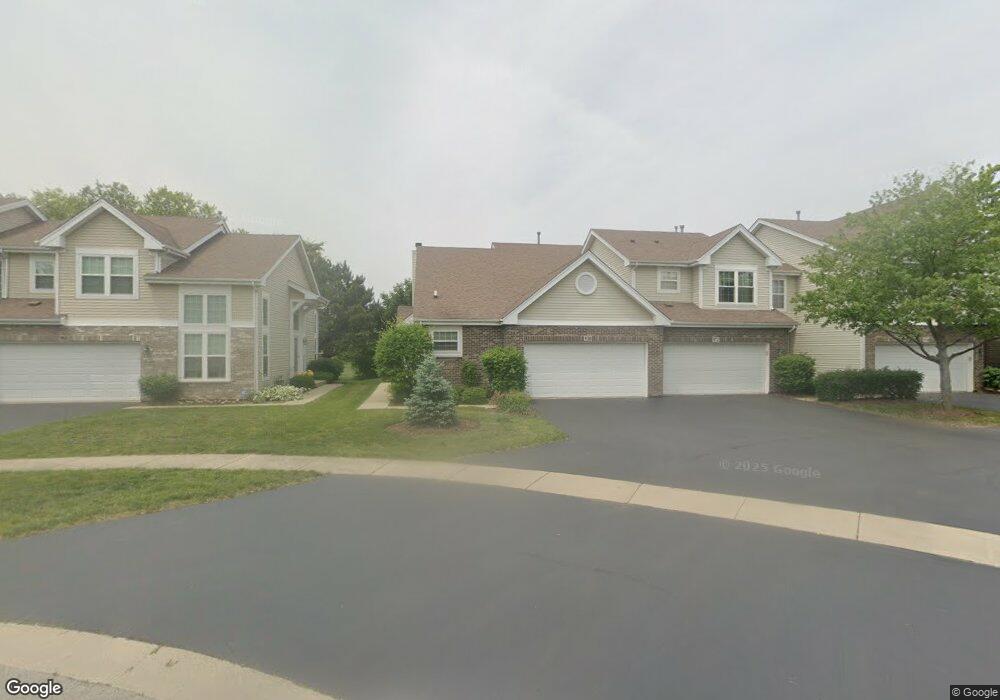
970 Willow St Itasca, IL 60143
North Itasca NeighborhoodEstimated Value: $397,000 - $456,000
2
Beds
3
Baths
1,683
Sq Ft
$251/Sq Ft
Est. Value
About This Home
This home is located at 970 Willow St, Itasca, IL 60143 and is currently estimated at $422,238, approximately $250 per square foot. 970 Willow St is a home located in DuPage County with nearby schools including Raymond Benson Primary School, Elmer H Franzen Intermediate School, and F.E. Peacock Middle School.
Ownership History
Date
Name
Owned For
Owner Type
Purchase Details
Closed on
Sep 13, 2016
Sold by
Woods Deborah A
Bought by
Seavey Celeste and Celeste M Seavey Living Trust
Current Estimated Value
Purchase Details
Closed on
Mar 30, 2004
Sold by
Golf Jerry L
Bought by
Woods Deborah A
Home Financials for this Owner
Home Financials are based on the most recent Mortgage that was taken out on this home.
Original Mortgage
$236,500
Interest Rate
5.65%
Mortgage Type
Purchase Money Mortgage
Purchase Details
Closed on
Jan 4, 1996
Sold by
Mitco Inc
Bought by
Golf Jerry Lee
Home Financials for this Owner
Home Financials are based on the most recent Mortgage that was taken out on this home.
Original Mortgage
$150,000
Interest Rate
7.41%
Create a Home Valuation Report for This Property
The Home Valuation Report is an in-depth analysis detailing your home's value as well as a comparison with similar homes in the area
Home Values in the Area
Average Home Value in this Area
Purchase History
| Date | Buyer | Sale Price | Title Company |
|---|---|---|---|
| Seavey Celeste | $250,000 | Fidelity National Title | |
| Woods Deborah A | $316,500 | Ctic | |
| Golf Jerry Lee | $209,000 | -- |
Source: Public Records
Mortgage History
| Date | Status | Borrower | Loan Amount |
|---|---|---|---|
| Previous Owner | Woods Deborah A | $236,500 | |
| Previous Owner | Golf Jerry Lee | $150,000 |
Source: Public Records
Tax History
| Year | Tax Paid | Tax Assessment Tax Assessment Total Assessment is a certain percentage of the fair market value that is determined by local assessors to be the total taxable value of land and additions on the property. | Land | Improvement |
|---|---|---|---|---|
| 2024 | $7,695 | $127,849 | $8,398 | $119,451 |
| 2023 | $7,320 | $117,530 | $7,720 | $109,810 |
| 2022 | $6,899 | $107,640 | $7,070 | $100,570 |
| 2021 | $6,541 | $103,100 | $6,770 | $96,330 |
| 2020 | $6,275 | $98,750 | $6,480 | $92,270 |
| 2019 | $6,111 | $94,950 | $6,230 | $88,720 |
| 2018 | $5,931 | $90,060 | $6,230 | $83,830 |
| 2017 | $5,556 | $86,070 | $5,950 | $80,120 |
| 2016 | $5,609 | $79,460 | $5,490 | $73,970 |
| 2015 | $5,544 | $73,400 | $5,070 | $68,330 |
| 2014 | $5,767 | $66,730 | $4,610 | $62,120 |
| 2013 | $5,627 | $68,090 | $4,700 | $63,390 |
Source: Public Records
Map
Nearby Homes
- 829 Clover Ridge Ln
- 274 Wildspring Ct Unit 92
- 720 N Maple St
- 259 Millers Crossing Unit 236
- 201 Millers Crossing Unit 224
- 244 Millers Crossing Unit 244
- 301 Nicole Way
- 417 W Pierce Rd
- 416 N Rush St
- 620 Stone Brook Ct Unit 432
- 1239 Old Mill Ln Unit 401
- 741 Old Creek Ct Unit 793
- 1162 Talbots Ln Unit 923
- 100 S Walnut St
- 711 E Greenview Rd
- 922 Little Falls Ct Unit 1016
- 733 Clover Hill Ct
- 974 Mayfair Ct Unit 83714
- 909 Mayfair Ct Unit 115713
- 1576 Von Braun Trail
- 972 Willow St
- 974 Willow St
- 968 Willow St
- 976 Willow St
- 964 Willow St
- 980 Willow St
- 982 Willow St
- 984 Willow St
- 960 Willow St
- 986 Willow St
- 903 Clover Ridge Ln
- 958 Willow St Unit 41
- 909 Clover Ridge Ln
- 981 Willow St Unit 111
- 956 Willow St
- 983 Willow St Unit 112
- 899 Clover Ridge Ln
- 985 Willow St Unit 113
- 987 Willow St
- 954 Willow St
Your Personal Tour Guide
Ask me questions while you tour the home.