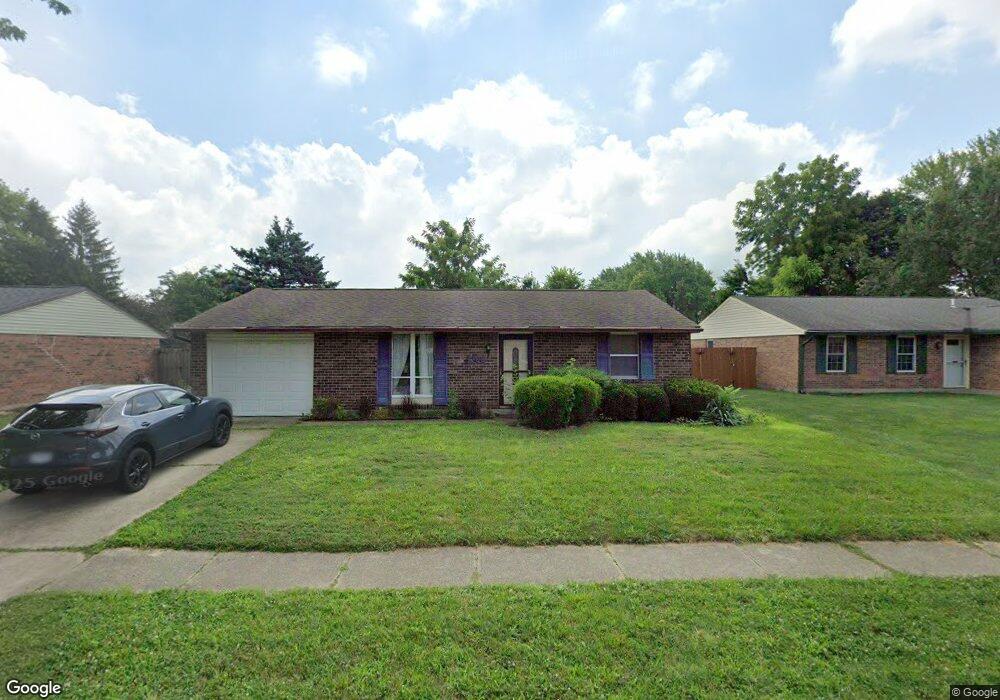
9700 Springwater Ln Miamisburg, OH 45342
Estimated Value: $185,000 - $211,000
2
Beds
1
Bath
918
Sq Ft
$218/Sq Ft
Est. Value
About This Home
This home is located at 9700 Springwater Ln, Miamisburg, OH 45342 and is currently estimated at $199,929, approximately $217 per square foot. 9700 Springwater Ln is a home located in Montgomery County with nearby schools including Miamisburg High School, The CinDay Academy, and Dayton Christian School.
Ownership History
Date
Name
Owned For
Owner Type
Purchase Details
Closed on
Jun 28, 2011
Sold by
Bolen Lori L and Bolen Shaun Thomas
Bought by
Norris James K
Current Estimated Value
Home Financials for this Owner
Home Financials are based on the most recent Mortgage that was taken out on this home.
Original Mortgage
$86,251
Outstanding Balance
$58,605
Interest Rate
4.25%
Mortgage Type
FHA
Estimated Equity
$141,324
Purchase Details
Closed on
Feb 5, 2004
Sold by
Dinsmoor Gregory R and Dinsmoor Jennifer M
Bought by
Glancy Lori L
Home Financials for this Owner
Home Financials are based on the most recent Mortgage that was taken out on this home.
Original Mortgage
$87,300
Interest Rate
5.96%
Mortgage Type
Purchase Money Mortgage
Purchase Details
Closed on
Sep 30, 1999
Sold by
Reeder Dianne L
Bought by
Dinsmoor Gregory R and Dinsmoor Jennifer M
Home Financials for this Owner
Home Financials are based on the most recent Mortgage that was taken out on this home.
Original Mortgage
$84,944
Interest Rate
7.83%
Mortgage Type
FHA
Create a Home Valuation Report for This Property
The Home Valuation Report is an in-depth analysis detailing your home's value as well as a comparison with similar homes in the area
Home Values in the Area
Average Home Value in this Area
Purchase History
| Date | Buyer | Sale Price | Title Company |
|---|---|---|---|
| Norris James K | $88,500 | Attorney | |
| Glancy Lori L | $87,300 | -- | |
| Dinsmoor Gregory R | $85,000 | -- |
Source: Public Records
Mortgage History
| Date | Status | Borrower | Loan Amount |
|---|---|---|---|
| Open | Norris James K | $86,251 | |
| Previous Owner | Glancy Lori L | $87,300 | |
| Previous Owner | Dinsmoor Gregory R | $84,944 |
Source: Public Records
Tax History Compared to Growth
Tax History
| Year | Tax Paid | Tax Assessment Tax Assessment Total Assessment is a certain percentage of the fair market value that is determined by local assessors to be the total taxable value of land and additions on the property. | Land | Improvement |
|---|---|---|---|---|
| 2024 | $3,598 | $52,890 | $13,180 | $39,710 |
| 2023 | $3,598 | $51,500 | $13,180 | $38,320 |
| 2022 | $3,321 | $39,310 | $10,060 | $29,250 |
| 2021 | $3,054 | $39,310 | $10,060 | $29,250 |
| 2020 | $3,048 | $39,310 | $10,060 | $29,250 |
| 2019 | $2,807 | $32,760 | $8,750 | $24,010 |
| 2018 | $2,787 | $32,760 | $8,750 | $24,010 |
| 2017 | $2,771 | $32,760 | $8,750 | $24,010 |
| 2016 | $2,447 | $27,660 | $8,750 | $18,910 |
| 2015 | $2,407 | $27,660 | $8,750 | $18,910 |
| 2014 | $2,407 | $27,660 | $8,750 | $18,910 |
| 2012 | -- | $28,290 | $10,500 | $17,790 |
Source: Public Records
Map
Nearby Homes
- 9850 Aylesworth Ln
- 2540 Colinda Ct
- 10123 Heartwood Ct
- 2115 Autumn Haze Trail
- 9607 Olde Georgetown
- 9747 Cobblewood Ct
- 9616 Wild Ginger Way
- 1800 Olde Haley Dr
- 9604 Tahoe Dr
- 9553 Tahoe Dr
- 1794 Placid Dr
- 9406 Tahoe Dr Unit 19406
- 9540 Tahoe Dr
- 9764 Olde Georgetown Way
- 9519 Tahoe Dr
- 9515 Tahoe Dr
- 9475 Copperton Dr
- 9266 Great Lakes Cir Unit 29266
- 2378 Ferndown Dr
- 9372 Parkside Dr
- 9708 Springwater Ln
- 9692 Springwater Ln
- 2451 Chaffman Ct
- 9684 Springwater Ln
- 9716 Springwater Ln
- 2430 Chaffman Ct
- 9701 Springwater Ln
- 9691 Springwater Ln
- 2431 Chaffman Ct
- 9724 Springwater Ln
- 9676 Springwater Ln
- 9685 Springwater Ln
- 2420 Chaffman Ct
- 2641 Gladwin Ct
- 2631 Gladwin Ct
- 2631 Gladwin Ct Unit Miamisburg
- 2421 Chaffman Ct
- 9541 Stanford Ridge Ct
- 9668 Springwater Ln
- 9677 Springwater Ln