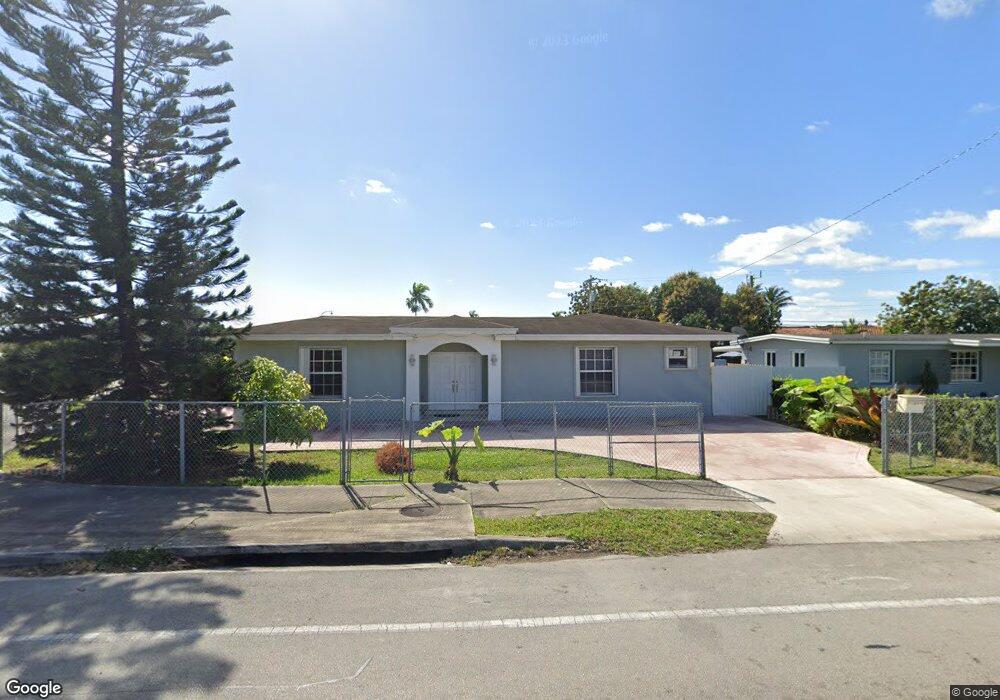
9700 SW 48th St Miami, FL 33165
Olympia Heights NeighborhoodEstimated Value: $637,230 - $784,000
3
Beds
1
Bath
1,682
Sq Ft
$412/Sq Ft
Est. Value
About This Home
This home is located at 9700 SW 48th St, Miami, FL 33165 and is currently estimated at $692,308, approximately $411 per square foot. 9700 SW 48th St is a home located in Miami-Dade County with nearby schools including Tropical Elementary School, Riviera Middle School, and Southwest Miami Senior High School.
Ownership History
Date
Name
Owned For
Owner Type
Purchase Details
Closed on
Dec 23, 2013
Sold by
Trujillo Orestes Yovani and Trujillo Angelina
Bought by
Casanova Alicia A
Current Estimated Value
Purchase Details
Closed on
Jun 6, 2001
Sold by
Felix Tapanes M and Alba Tapanes M
Bought by
Trujillo Orestes Y and Trujillo Angelina
Purchase Details
Closed on
May 10, 1999
Sold by
Perez Jose A and Perez Doriela I
Bought by
Tapanes Felix and Tapanes Alba
Home Financials for this Owner
Home Financials are based on the most recent Mortgage that was taken out on this home.
Original Mortgage
$106,850
Interest Rate
7%
Mortgage Type
New Conventional
Purchase Details
Closed on
Aug 20, 1993
Sold by
Herrera Santos S
Bought by
Perez Jose A and Perez Doriela I
Home Financials for this Owner
Home Financials are based on the most recent Mortgage that was taken out on this home.
Original Mortgage
$82,400
Interest Rate
7.22%
Mortgage Type
FHA
Create a Home Valuation Report for This Property
The Home Valuation Report is an in-depth analysis detailing your home's value as well as a comparison with similar homes in the area
Home Values in the Area
Average Home Value in this Area
Purchase History
| Date | Buyer | Sale Price | Title Company |
|---|---|---|---|
| Casanova Alicia A | $280,000 | Attorney | |
| Trujillo Orestes Y | $135,000 | -- | |
| Tapanes Felix | $112,500 | -- | |
| Perez Jose A | $83,000 | -- |
Source: Public Records
Mortgage History
| Date | Status | Borrower | Loan Amount |
|---|---|---|---|
| Previous Owner | Tapanes Felix | $129,200 | |
| Previous Owner | Tapanes Felix | $106,850 | |
| Previous Owner | Perez Jose A | $82,400 |
Source: Public Records
Tax History Compared to Growth
Tax History
| Year | Tax Paid | Tax Assessment Tax Assessment Total Assessment is a certain percentage of the fair market value that is determined by local assessors to be the total taxable value of land and additions on the property. | Land | Improvement |
|---|---|---|---|---|
| 2025 | $9,351 | $514,883 | -- | -- |
| 2024 | $8,405 | $468,076 | -- | -- |
| 2023 | $8,405 | $425,524 | $0 | $0 |
| 2022 | $7,555 | $386,840 | $0 | $0 |
| 2021 | $6,722 | $351,673 | $183,770 | $167,903 |
| 2020 | $6,319 | $327,855 | $183,770 | $144,085 |
| 2019 | $6,213 | $320,962 | $175,780 | $145,182 |
| 2018 | $6,088 | $322,059 | $175,780 | $146,279 |
| 2017 | $5,745 | $299,187 | $0 | $0 |
| 2016 | $5,433 | $276,310 | $0 | $0 |
| 2015 | $5,080 | $251,598 | $0 | $0 |
| 2014 | -- | $228,726 | $0 | $0 |
Source: Public Records
Map
Nearby Homes
- 9625 SW 47th St
- 9816 NW 51st Terrace
- 9930 SW 48th St
- 5250 SW 96th Ave
- 4850 SW 93rd Ct
- 4801 SW 98th Avenue Rd
- 5365 SW 97th Ct
- 9491 SW 54th St
- 4321 SW 99th Ave
- 4311 SW 95th Ct
- 9365 SW 44th St
- 4235 SW 97th Ave
- 4325 SW 95th Ave
- 4211 SW 97th Place
- 10031 SW 46th St
- 10030 SW 51st Terrace
- 9351 SW 53rd St
- 4202 SW 98th Ave
- 5435 SW 99th Ct
- 9701 SW 56th Terrace
- 9710 SW 48th St
- 4830 SW 97th Ave
- 9620 SW 48th St
- 9720 SW 48th St
- 9701 SW 48th St
- 9621 SW 49th St Unit A
- 9621 SW 49th St
- 4840 SW 97th Ave
- 9731 SW 48th St
- 9730 SW 48th St
- 9610 SW 48th St
- 9635 SW 48th St
- 4730 SW 97th Ave
- 9611 SW 49th St
- 4872 SW 97th Ave Unit 289
- 4900 SW 97th Ave
- 9741 SW 48th St
- 4901 SW 97th Ave
- 4901 SW 97th Ct