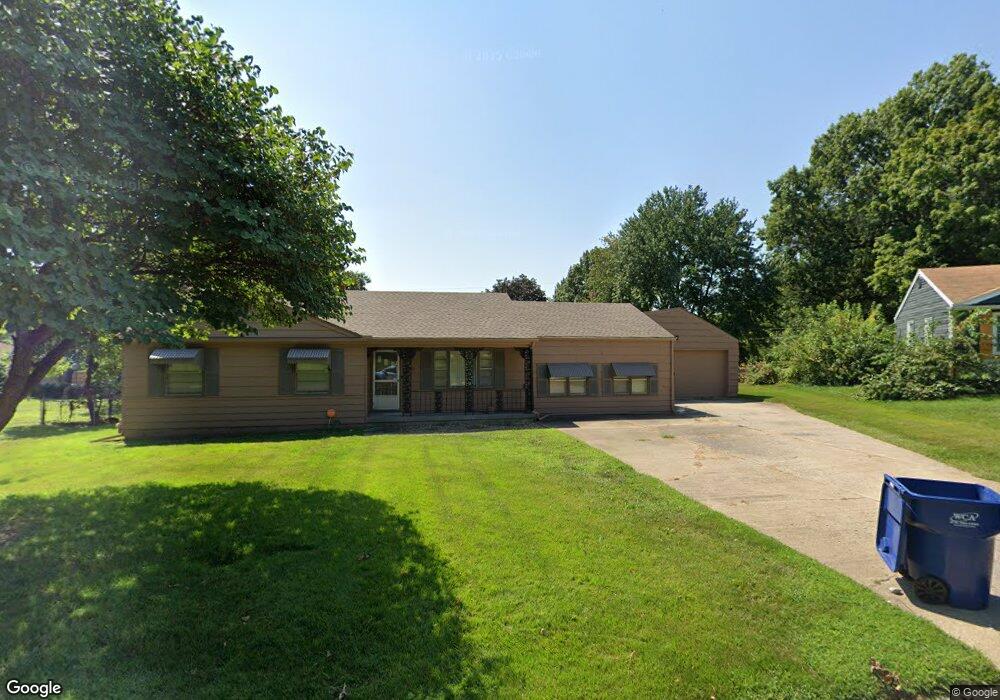
9701 E 81st Terrace Raytown, MO 64138
Estimated Value: $216,000 - $273,000
3
Beds
2
Baths
1,528
Sq Ft
$160/Sq Ft
Est. Value
About This Home
This home is located at 9701 E 81st Terrace, Raytown, MO 64138 and is currently estimated at $244,637, approximately $160 per square foot. 9701 E 81st Terrace is a home located in Jackson County with nearby schools including Southwood Elementary, South Middle School, and Carver Christian Academy.
Ownership History
Date
Name
Owned For
Owner Type
Purchase Details
Closed on
Sep 10, 2002
Sold by
Va
Bought by
James Dennis P and James Donna L
Current Estimated Value
Home Financials for this Owner
Home Financials are based on the most recent Mortgage that was taken out on this home.
Original Mortgage
$101,350
Outstanding Balance
$15,362
Interest Rate
6.5%
Mortgage Type
Seller Take Back
Estimated Equity
$229,275
Purchase Details
Closed on
Mar 22, 2002
Sold by
Homeside Lending Inc
Bought by
Va
Purchase Details
Closed on
Mar 7, 2002
Sold by
Kee Jeremy J and Kee Tonia J
Bought by
Homeside Lending Inc
Purchase Details
Closed on
Jun 16, 2000
Sold by
Wyrick David E and Wyrick Irene M
Bought by
Kee Jeremy J and Kee Tonia J
Home Financials for this Owner
Home Financials are based on the most recent Mortgage that was taken out on this home.
Original Mortgage
$89,964
Interest Rate
8.3%
Mortgage Type
VA
Create a Home Valuation Report for This Property
The Home Valuation Report is an in-depth analysis detailing your home's value as well as a comparison with similar homes in the area
Home Values in the Area
Average Home Value in this Area
Purchase History
| Date | Buyer | Sale Price | Title Company |
|---|---|---|---|
| James Dennis P | -- | Security Land Title Company | |
| Va | -- | First Financial Title | |
| Homeside Lending Inc | $77,555 | First Financial Title | |
| Kee Jeremy J | -- | Ati Title Company |
Source: Public Records
Mortgage History
| Date | Status | Borrower | Loan Amount |
|---|---|---|---|
| Open | James Dennis P | $101,350 | |
| Previous Owner | Kee Jeremy J | $89,964 |
Source: Public Records
Tax History
| Year | Tax Paid | Tax Assessment Tax Assessment Total Assessment is a certain percentage of the fair market value that is determined by local assessors to be the total taxable value of land and additions on the property. | Land | Improvement |
|---|---|---|---|---|
| 2025 | $2,571 | $31,836 | $5,396 | $26,440 |
| 2024 | $2,554 | $28,500 | $4,672 | $23,828 |
| 2023 | $2,554 | $28,500 | $4,672 | $23,828 |
| 2022 | $2,341 | $24,890 | $5,323 | $19,567 |
| 2021 | $2,349 | $24,890 | $5,323 | $19,567 |
| 2020 | $2,365 | $24,817 | $5,323 | $19,494 |
| 2019 | $2,352 | $24,817 | $5,323 | $19,494 |
| 2018 | $1,977 | $21,599 | $4,633 | $16,966 |
| 2017 | $1,977 | $21,599 | $4,633 | $16,966 |
| 2016 | $1,916 | $21,057 | $3,914 | $17,143 |
Source: Public Records
Map
Nearby Homes
- 9700 E 82nd Terrace
- 9601 E 83rd St
- 9306 E 81st St
- 8012 Elm Ave
- 9807 E 79th Terrace
- 9509 E 79th St
- 7901 Maple Ave
- 7900 Maple Ave
- 10308 E 81st St
- 8117 Manning Ave
- 9325 E 85th St
- 7725 Arlington Ave
- 9005 E 84th St
- 8516 Ditzler Ave
- 9812 E 77th Terrace
- 8220 Willow Way
- 9027 E 85th Terrace
- 9201 E 87th St
- 8816 E 81st St
- 8816 E 84th St
- 8108 Evanston Ave
- 9700 E 82nd St
- 9705 E 81st Terrace
- 9704 E 82nd St
- 9700 E 81st Terrace
- 9706 E 82nd St
- 8200 Evanston Ave
- 9709 E 81st Terrace
- 8106 Evanston Ave
- 9704 E 81st Terrace
- 9708 E 82nd St
- 8204 Evanston Ave
- 9711 E 81st Terrace
- 9701 E 82nd St
- 9708 E 81st Terrace
- 8104 Evanston Ave
- 9705 E 82nd St
- 9701 E 81st St
- 9712 E 82nd St
- 8206 Evanston Ave
Your Personal Tour Guide
Ask me questions while you tour the home.