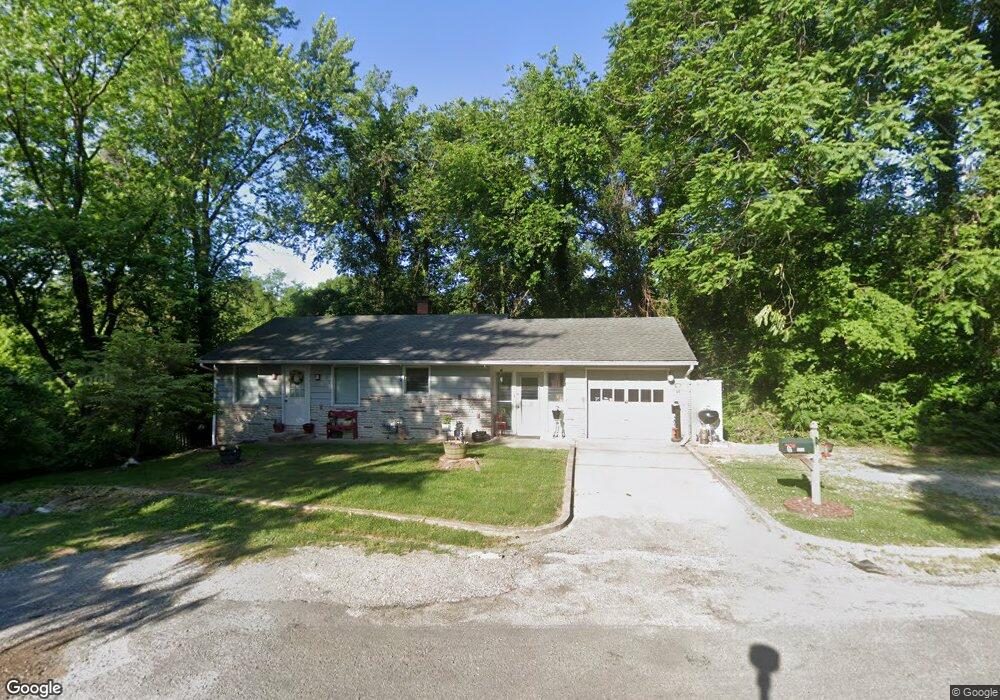
9701 Raymond Dr Belleville, IL 62223
Estimated Value: $133,000 - $169,411
--
Bed
--
Bath
800
Sq Ft
$188/Sq Ft
Est. Value
About This Home
This home is located at 9701 Raymond Dr, Belleville, IL 62223 and is currently estimated at $150,353, approximately $187 per square foot. 9701 Raymond Dr is a home located in St. Clair County with nearby schools including Signal Hill Elementary School, Blessed Sacrament Catholic School, and Sister Thea Bowman Catholic School.
Ownership History
Date
Name
Owned For
Owner Type
Purchase Details
Closed on
Sep 20, 2024
Sold by
Frey Dennis and Oconnell Jessica
Bought by
Frey Dennis J and Oconnell Jessica A
Current Estimated Value
Home Financials for this Owner
Home Financials are based on the most recent Mortgage that was taken out on this home.
Original Mortgage
$87,505
Outstanding Balance
$86,527
Interest Rate
6.5%
Mortgage Type
FHA
Estimated Equity
$63,826
Purchase Details
Closed on
Aug 18, 2004
Sold by
Snolib Llc
Bought by
Frey Dennis and Oconnell Jessica
Home Financials for this Owner
Home Financials are based on the most recent Mortgage that was taken out on this home.
Original Mortgage
$74,500
Interest Rate
8%
Mortgage Type
Purchase Money Mortgage
Purchase Details
Closed on
Feb 5, 2004
Sold by
Lasalle Bank Na
Bought by
Snolib Llc
Purchase Details
Closed on
Apr 24, 2003
Sold by
Bradac Fred
Bought by
Lasalle Bank Na
Create a Home Valuation Report for This Property
The Home Valuation Report is an in-depth analysis detailing your home's value as well as a comparison with similar homes in the area
Home Values in the Area
Average Home Value in this Area
Purchase History
| Date | Buyer | Sale Price | Title Company |
|---|---|---|---|
| Frey Dennis J | -- | None Available | |
| Frey Dennis | $72,500 | Fatic | |
| Snolib Llc | $24,000 | First American Title Insuran | |
| Lasalle Bank Na | -- | -- |
Source: Public Records
Mortgage History
| Date | Status | Borrower | Loan Amount |
|---|---|---|---|
| Open | Frey Dennis J | $87,505 | |
| Previous Owner | Frey Dennis | $74,500 |
Source: Public Records
Tax History Compared to Growth
Tax History
| Year | Tax Paid | Tax Assessment Tax Assessment Total Assessment is a certain percentage of the fair market value that is determined by local assessors to be the total taxable value of land and additions on the property. | Land | Improvement |
|---|---|---|---|---|
| 2024 | $3,027 | $36,991 | $9,249 | $27,742 |
| 2023 | $2,462 | $30,418 | $9,065 | $21,353 |
| 2022 | $2,189 | $27,384 | $8,161 | $19,223 |
| 2021 | $2,053 | $25,316 | $7,545 | $17,771 |
| 2020 | $1,910 | $23,431 | $7,135 | $16,296 |
| 2019 | $1,570 | $20,248 | $7,146 | $13,102 |
| 2018 | $1,518 | $19,810 | $6,991 | $12,819 |
| 2017 | $1,504 | $19,670 | $6,942 | $12,728 |
| 2016 | $1,467 | $19,253 | $6,795 | $12,458 |
| 2014 | $1,631 | $22,379 | $6,086 | $16,293 |
| 2013 | $1,853 | $22,699 | $6,173 | $16,526 |
Source: Public Records
Map
Nearby Homes
- 80 N 98th St
- 6 N 95th St
- 24 S 95th St
- 31 S 97th St
- 100 S 98th St
- 14 Granvue Dr
- 8612 Main St W
- 38 Granvue Dr
- 212 Woodcrest Dr
- 38 S 86th St
- 0 Holdener Dr
- 20 Hilldale Dr
- 6 Woodcrest Dr
- 211 Country Club Ln
- 6 Hilltop Place
- 22 Country Club Place
- 1 AC Highridge Dr
- 134 N 82nd St
- 9629 Holdener Place
- 102 N 81st St