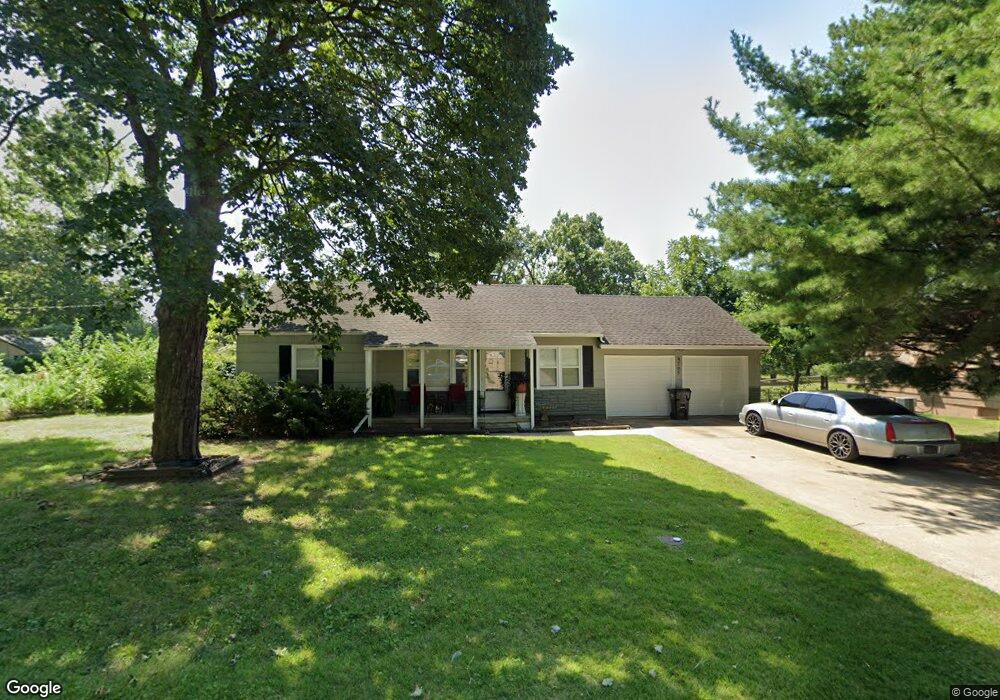
9705 E 81st Terrace Raytown, MO 64138
Estimated Value: $184,974 - $211,000
3
Beds
1
Bath
926
Sq Ft
$212/Sq Ft
Est. Value
About This Home
This home is located at 9705 E 81st Terrace, Raytown, MO 64138 and is currently estimated at $196,325, approximately $212 per square foot. 9705 E 81st Terrace is a home located in Jackson County with nearby schools including Southwood Elementary, South Middle School, and Carver Christian Academy.
Ownership History
Date
Name
Owned For
Owner Type
Purchase Details
Closed on
Feb 21, 2017
Sold by
Th Issen Tamara D and Karus Jacob W
Bought by
Ray Jon C and Ray Cynthia L
Current Estimated Value
Purchase Details
Closed on
Apr 22, 2010
Sold by
Thissen Tamara D
Bought by
Thissen Tamara D
Purchase Details
Closed on
Mar 17, 2010
Sold by
Thissen Tamara D and Kraus Jacob W
Bought by
Kraus Tamara Thissen
Purchase Details
Closed on
Feb 22, 2008
Sold by
All Inclusive Real Estate Llc
Bought by
Thissen Tamara D and Kraus Jacob
Purchase Details
Closed on
Jun 2, 2004
Sold by
Prentice Cindy L and Prentice Cindy Lou
Bought by
All Inclusive Real Estate Llc and A Home 4 U
Purchase Details
Closed on
Aug 1, 1998
Sold by
Wyrick Ernest D and Wyrick Irene M
Bought by
Prentice Brad J and Prentice Cindy Lou
Home Financials for this Owner
Home Financials are based on the most recent Mortgage that was taken out on this home.
Original Mortgage
$62,800
Interest Rate
7.5%
Mortgage Type
Seller Take Back
Create a Home Valuation Report for This Property
The Home Valuation Report is an in-depth analysis detailing your home's value as well as a comparison with similar homes in the area
Home Values in the Area
Average Home Value in this Area
Purchase History
| Date | Buyer | Sale Price | Title Company |
|---|---|---|---|
| Ray Jon C | $33,000 | None Available | |
| Ray Jon C | $33,000 | None Available | |
| Thissen Tamara D | -- | None Available | |
| Kraus Tamara Thissen | -- | None Available | |
| Thissen Tamara D | -- | None Available | |
| All Inclusive Real Estate Llc | -- | Ati Title Company | |
| Prentice Brad J | -- | -- |
Source: Public Records
Mortgage History
| Date | Status | Borrower | Loan Amount |
|---|---|---|---|
| Previous Owner | Prentice Brad J | $62,800 |
Source: Public Records
Tax History
| Year | Tax Paid | Tax Assessment Tax Assessment Total Assessment is a certain percentage of the fair market value that is determined by local assessors to be the total taxable value of land and additions on the property. | Land | Improvement |
|---|---|---|---|---|
| 2025 | $2,190 | $21,859 | $5,352 | $16,507 |
| 2024 | $2,176 | $24,282 | $4,628 | $19,654 |
| 2023 | $2,176 | $24,282 | $3,811 | $20,471 |
| 2022 | $1,555 | $16,530 | $3,544 | $12,986 |
| 2021 | $1,560 | $16,530 | $3,544 | $12,986 |
| 2020 | $1,576 | $16,533 | $3,544 | $12,989 |
| 2019 | $1,567 | $16,533 | $3,544 | $12,989 |
| 2018 | $1,378 | $15,055 | $3,229 | $11,826 |
| 2017 | $1,378 | $15,055 | $3,229 | $11,826 |
| 2016 | $1,336 | $14,677 | $3,718 | $10,959 |
Source: Public Records
Map
Nearby Homes
- 9800 E 81st Terrace
- 9700 E 82nd Terrace
- 9703 E 80th Terrace
- 9809 E 82nd Terrace
- 8112 Raytown Rd
- 9408 E 81st Terrace
- 9601 E 83rd St
- 8002 Evanston Ave
- 9404 E 83rd St
- 9306 E 81st St
- 9807 E 79th Terrace
- 8012 Elm Ave
- 9703 E 79th St
- 7916 Maple Ave
- 9509 E 79th St
- 10109 E 83rd Terrace
- 7901 Maple Ave
- 10308 E 81st St
- 7900 Maple Ave
- 9325 E 85th St
- 9709 E 81st Terrace
- 9704 E 82nd St
- 9701 E 81st Terrace
- 9706 E 82nd St
- 9700 E 82nd St
- 9711 E 81st Terrace
- 9708 E 82nd St
- 9704 E 81st Terrace
- 8108 Evanston Ave
- 9700 E 81st Terrace
- 9708 E 81st Terrace
- 9712 E 82nd St
- 8200 Evanston Ave
- 9701 E 82nd St
- 9705 E 82nd St
- 9712 E 81st Terrace
- 9801 E 81st Terrace
- 8106 Evanston Ave
- 9709 E 82nd St
- 9800 E 82nd St
Your Personal Tour Guide
Ask me questions while you tour the home.