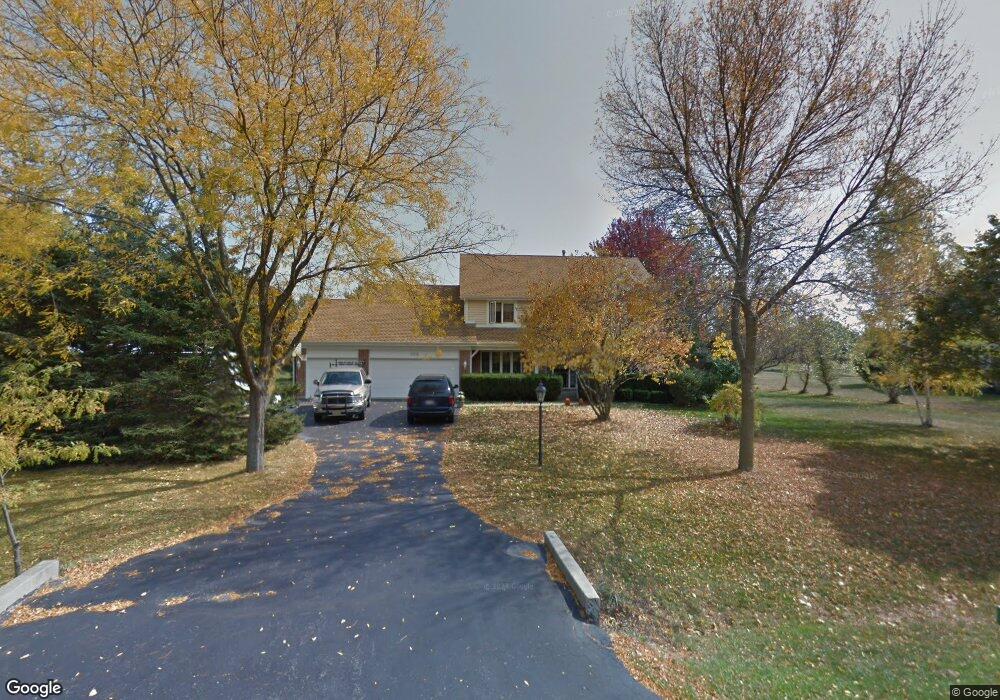
9708 Bonner Ln Spring Grove, IL 60081
Estimated Value: $475,174 - $495,000
4
Beds
3
Baths
2,600
Sq Ft
$185/Sq Ft
Est. Value
About This Home
This home is located at 9708 Bonner Ln, Spring Grove, IL 60081 and is currently estimated at $481,544, approximately $185 per square foot. 9708 Bonner Ln is a home located in McHenry County with nearby schools including Richmond Grade School, Nippersink Middle School, and Richmond-Burton High School.
Ownership History
Date
Name
Owned For
Owner Type
Purchase Details
Closed on
Jan 13, 2022
Sold by
Mitterling Edward J and Dehne-Mitterling Sladjana
Bought by
Mitterling Edward J and Dehne-Mitterling Sladjana
Current Estimated Value
Purchase Details
Closed on
Aug 29, 2012
Sold by
Peters Sandra L and Spence Susan L
Bought by
Mitterling Edward J and Dehne Mitterling Sladjana
Home Financials for this Owner
Home Financials are based on the most recent Mortgage that was taken out on this home.
Original Mortgage
$214,051
Interest Rate
3.25%
Mortgage Type
FHA
Purchase Details
Closed on
Aug 11, 2010
Sold by
Peters Sandra L
Bought by
Peters Sandra L and Spence Susan L
Purchase Details
Closed on
Feb 4, 2005
Sold by
Peters Herbert O and Peters Lois F
Bought by
Peters Herbert O
Create a Home Valuation Report for This Property
The Home Valuation Report is an in-depth analysis detailing your home's value as well as a comparison with similar homes in the area
Home Values in the Area
Average Home Value in this Area
Purchase History
| Date | Buyer | Sale Price | Title Company |
|---|---|---|---|
| Mitterling Edward J | -- | None Listed On Document | |
| Mitterling Edward J | $218,000 | Heritage Title Company | |
| Peters Sandra L | -- | None Available | |
| Peters Herbert O | -- | -- |
Source: Public Records
Mortgage History
| Date | Status | Borrower | Loan Amount |
|---|---|---|---|
| Previous Owner | Mitterling Edward J | $214,051 |
Source: Public Records
Tax History Compared to Growth
Tax History
| Year | Tax Paid | Tax Assessment Tax Assessment Total Assessment is a certain percentage of the fair market value that is determined by local assessors to be the total taxable value of land and additions on the property. | Land | Improvement |
|---|---|---|---|---|
| 2024 | $9,362 | $130,404 | $28,941 | $101,463 |
| 2023 | $9,095 | $119,210 | $26,457 | $92,753 |
| 2022 | $8,777 | $107,338 | $23,822 | $83,516 |
| 2021 | $8,498 | $103,021 | $22,864 | $80,157 |
| 2020 | $8,363 | $99,125 | $21,999 | $77,126 |
| 2019 | $8,267 | $95,940 | $21,292 | $74,648 |
| 2018 | $8,339 | $91,976 | $20,412 | $71,564 |
| 2017 | $8,339 | $87,588 | $19,438 | $68,150 |
| 2016 | $8,209 | $82,119 | $18,224 | $63,895 |
| 2013 | -- | $77,644 | $17,231 | $60,413 |
Source: Public Records
Map
Nearby Homes
- 1914 Spring Dale Dr
- 10201 Fox Bluff Ln
- 9436 Bellaire Ln
- 2303 Fox Bluff Ln
- 8720 Galleria Ct
- 11013 Serenity Path
- 11101 Serenity Path
- 11111 Huron Dr
- 8789 Bentley Ln
- 2214 Main Street Rd
- 8207 Squirrel Dr
- 8501 Country Shire Ln
- 8610 Steeple Ln
- 9206 N Clark Rd
- Lot 65 & 66 Main Street Rd
- 8303 Appaloosa Ln
- 8300 Appaloosa Ln
- Lot 16 Harding
- Lot 61 Beverly Way
- Lot 57 Beverly Way
- 9802 Bonner Ln
- 9706 Bonner Ln
- 2003 W Hunters Ln
- 9707 Bonner Ln
- 9804 Bonner Ln
- 9705 Bonner Ln
- 9799 N Hunters Ln
- 9704 Bonner Ln
- 9777 N Hunters Ln
- 2101 W Hunters Ln
- 9805 N Hunters Ln
- 9702 Bonner Ln
- 9703 Bonner Ln
- 2103 W Hunters Ln
- 9831 N Hunters Ln
- 9733 N Hunters Ln
- 9708 Fox Bluff Ln
- 2004 W Hunters Ln
- 2006 W Hunters Ln
- 2002 W Hunters Ln