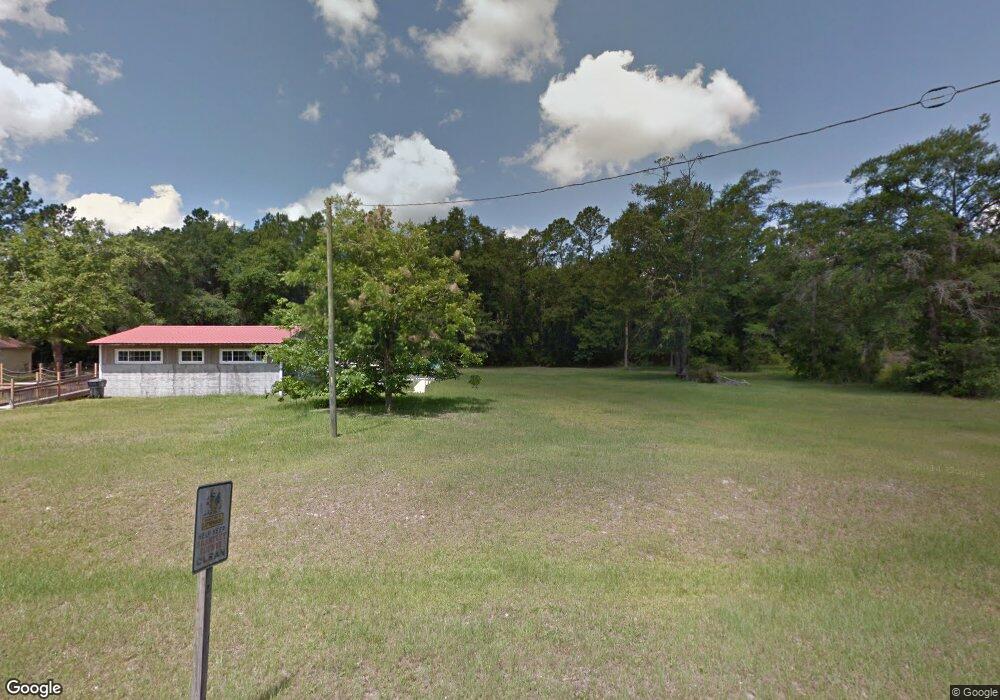
971 Cumberland Rd Hortense, GA 31543
Estimated Value: $124,763 - $181,000
2
Beds
1
Bath
1,000
Sq Ft
$162/Sq Ft
Est. Value
About This Home
This home is located at 971 Cumberland Rd, Hortense, GA 31543 and is currently estimated at $162,191, approximately $162 per square foot. 971 Cumberland Rd is a home located in Brantley County with nearby schools including Nahunta Primary School, Nahunta Elementary School, and Brantley County Middle School.
Ownership History
Date
Name
Owned For
Owner Type
Purchase Details
Closed on
Sep 20, 2017
Sold by
Barnes Teary R
Bought by
Vining Amber J and Vining Charlie F
Current Estimated Value
Home Financials for this Owner
Home Financials are based on the most recent Mortgage that was taken out on this home.
Original Mortgage
$76,000
Outstanding Balance
$63,397
Interest Rate
3.86%
Mortgage Type
VA
Estimated Equity
$98,794
Purchase Details
Closed on
Dec 29, 2014
Sold by
Bottoms Johhnie L
Bought by
Barnes Teary R
Purchase Details
Closed on
Jun 9, 2014
Sold by
Cordell Alisa J
Bought by
Bottoms Johhnie L
Purchase Details
Closed on
Apr 22, 2014
Sold by
Rogers George Scotty
Bought by
Cordell Alisa J
Purchase Details
Closed on
Dec 15, 2012
Sold by
Rogers George S
Bought by
Rogers Stan and Carver Jack C
Purchase Details
Closed on
Nov 1, 2012
Sold by
Stemburg Dorothy A
Bought by
Moody Debra S
Create a Home Valuation Report for This Property
The Home Valuation Report is an in-depth analysis detailing your home's value as well as a comparison with similar homes in the area
Purchase History
| Date | Buyer | Sale Price | Title Company |
|---|---|---|---|
| Vining Amber J | $76,000 | -- | |
| Barnes Teary R | -- | -- | |
| Bottoms Johhnie L | $26,000 | -- | |
| Cordell Alisa J | -- | -- | |
| Rogers Stan | -- | -- | |
| Moody Debra S | -- | -- |
Source: Public Records
Mortgage History
| Date | Status | Borrower | Loan Amount |
|---|---|---|---|
| Open | Vining Amber J | $76,000 |
Source: Public Records
Tax History
| Year | Tax Paid | Tax Assessment Tax Assessment Total Assessment is a certain percentage of the fair market value that is determined by local assessors to be the total taxable value of land and additions on the property. | Land | Improvement |
|---|---|---|---|---|
| 2025 | $782 | $47,590 | $4,756 | $42,834 |
| 2024 | $750 | $37,446 | $1,410 | $36,036 |
| 2023 | $322 | $37,318 | $1,282 | $36,036 |
| 2022 | $713 | $36,007 | $1,282 | $34,725 |
| 2021 | $702 | $25,071 | $1,282 | $23,789 |
| 2020 | $716 | $25,071 | $1,282 | $23,789 |
| 2019 | $716 | $25,071 | $1,282 | $23,789 |
| 2018 | $0 | $26,667 | $2,363 | $24,304 |
| 2017 | $0 | $12,899 | $2,363 | $10,536 |
| 2016 | $729 | $12,899 | $2,363 | $10,536 |
| 2015 | -- | $12,899 | $2,363 | $10,536 |
Source: Public Records
Map
Nearby Homes
- 603 Cumberland Rd
- 255 Spell Landing Rd
- 1365 Ballfield Rd
- 6911 Old Hortense Rd
- 599 Ed Harrell Rd
- 425 Hortense Screven Rd
- 14375 U S 301
- 143 Lisa Ln
- 00 (lot 78) Heritage Cir
- 00 (lot 76) Heritage Cir
- 00 (lot 75) Heritage Cir
- 0 Heritage Cir Unit 1655955
- 0 Heritage Cir Unit 1656067
- 0 Heritage Cir Unit 1656069
- 0 Heritage Cir Unit 1656065
- 00 (lot 68) Heritage Cir
- 25 Heritage Cir
- 00 (lot 69) Heritage Cir
- 00 (lot 24) Heritage Cir
- 0 Highway 110 (2 02 Acres) W Unit 10720448
- 1018 Cumberland Rd
- 943 Cumberland Rd
- 7448 Cumberland Rd
- 952 Cumberland Rd
- 7362 Highway 32 E
- 7448 Highway 32 E
- 681 Cumberland Rd
- 7222 Highway 32 E
- 597 Cumberland Rd
- 777 Cumberland Rd
- 844 Sawgrass Rd
- 7500 Highway 32 E
- 726 Cumberland Rd
- 806 Sawgrass Rd
- 7514 Highway 32 E
- 7118 Highway 32 E
- 7459 Highway 32 E
- 7459 Highway 32 E
- 770 Sawgrass Rd
- 0 Sawgrass Rd
Your Personal Tour Guide
Ask me questions while you tour the home.