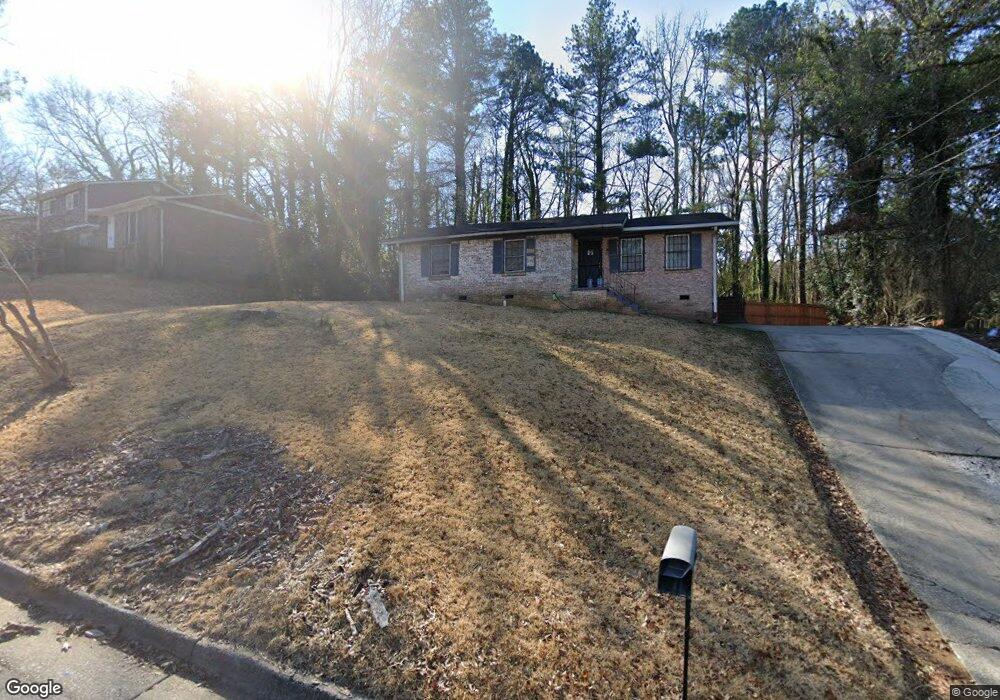
971 Forrest Dr SE Unit 1 Atlanta, GA 30354
South River Gardens NeighborhoodEstimated Value: $213,131 - $316,000
4
Beds
2
Baths
1,222
Sq Ft
$197/Sq Ft
Est. Value
About This Home
This home is located at 971 Forrest Dr SE Unit 1, Atlanta, GA 30354 and is currently estimated at $240,283, approximately $196 per square foot. 971 Forrest Dr SE Unit 1 is a home located in Fulton County with nearby schools including Humphries Elementary School, Long Middle School, and South Atlanta High School.
Ownership History
Date
Name
Owned For
Owner Type
Purchase Details
Closed on
Apr 30, 2014
Sold by
Cvb Properties Llc
Bought by
Myr Real Estate Llc
Current Estimated Value
Purchase Details
Closed on
Jul 20, 2009
Sold by
Federal Home Loan Mortgage Corporation
Bought by
Cvb Properties Llc
Purchase Details
Closed on
Jun 2, 2009
Sold by
Bac Home Loans Servicing
Bought by
Federal Home Loan Mortgage Corporation
Purchase Details
Closed on
Jun 19, 2007
Sold by
Rolader Properties Llc
Bought by
Jordan Renee
Home Financials for this Owner
Home Financials are based on the most recent Mortgage that was taken out on this home.
Original Mortgage
$121,500
Interest Rate
6.16%
Mortgage Type
New Conventional
Purchase Details
Closed on
Feb 2, 2007
Sold by
Bank Of New York Series 200
Bought by
Rolader Properties
Purchase Details
Closed on
Sep 5, 2006
Sold by
Young Selena P
Bought by
Bank Of New York Series 2001 & 1
Create a Home Valuation Report for This Property
The Home Valuation Report is an in-depth analysis detailing your home's value as well as a comparison with similar homes in the area
Home Values in the Area
Average Home Value in this Area
Purchase History
| Date | Buyer | Sale Price | Title Company |
|---|---|---|---|
| Myr Real Estate Llc | $27,200 | -- | |
| Cvb Properties Llc | -- | -- | |
| Federal Home Loan Mortgage Corporation | -- | -- | |
| Bac Home Loans Servicing | $53,000 | -- | |
| Jordan Renee | $135,000 | -- | |
| Rolader Properties | $70,000 | -- | |
| Bank Of New York Series 2001 & 1 | $76,186 | -- |
Source: Public Records
Mortgage History
| Date | Status | Borrower | Loan Amount |
|---|---|---|---|
| Previous Owner | Jordan Renee | $121,500 |
Source: Public Records
Tax History Compared to Growth
Tax History
| Year | Tax Paid | Tax Assessment Tax Assessment Total Assessment is a certain percentage of the fair market value that is determined by local assessors to be the total taxable value of land and additions on the property. | Land | Improvement |
|---|---|---|---|---|
| 2025 | $2,900 | $72,400 | $20,800 | $51,600 |
| 2023 | $1,588 | $38,360 | $7,760 | $30,600 |
| 2022 | $1,552 | $38,360 | $7,760 | $30,600 |
| 2021 | $1,554 | $38,360 | $7,760 | $30,600 |
| 2020 | $1,552 | $37,880 | $7,640 | $30,240 |
| 2019 | $497 | $37,200 | $7,520 | $29,680 |
| 2018 | $762 | $18,400 | $4,160 | $14,240 |
| 2017 | $468 | $10,844 | $2,764 | $8,080 |
| 2016 | $469 | $10,840 | $2,760 | $8,080 |
| 2015 | $471 | $10,840 | $2,760 | $8,080 |
| 2014 | $771 | $17,000 | $4,320 | $12,680 |
Source: Public Records
Map
Nearby Homes
- 3267 Donnebrook Ln SE
- 793 River Gardens Dr
- 667 Tara Cir SE
- 629 Sandys Ln SE
- 592 Waynes Ct SE
- 1026 Eisenhower Ct SE
- 500 Hutchens Rd SE
- 597 River Gardens Dr
- 3523 Garfield Way SE
- 3370 Eisenhower Cir SE
- 2996 Jonesboro Rd SE Unit D
- 2996 Jonesboro Rd SE Unit G
- 2996 Jonesboro Rd SE Unit J
- 571 Hancock Dr SE
- 495 Hancock Dr SE
- Waverly Plan at Reserve at South River Gardens
- Wynbrooke 4 Bedroom Plan at Reserve at South River Gardens
- Wynbrooke Brick Plan at Reserve at South River Gardens
- 971 Forrest Dr SE
- 0 Forrest Dr Unit 3165578
- 0 Forrest Dr Unit 7035893
- 961 Forrest Dr SE
- 981 Forrest Dr SE
- 985 Forrest Dr SE
- 312 Forrest Dr SE
- 1031 Forrest Dr SE
- 1041 Forrest Dr SE
- 951 Forrest Dr SE
- 991 Forrest Dr SE
- 980 Forrest Cir SE
- 988 Forrest Cir SE
- 972 Forrest Cir SE
- 972 Forrest Dr SE
- 962 Forrest Dr SE
- 996 Forrest Cir SE
- 943 Forrest Dr SE Unit 2
- 964 Forrest Cir SE
- 3087 Forrest Park Rd SE