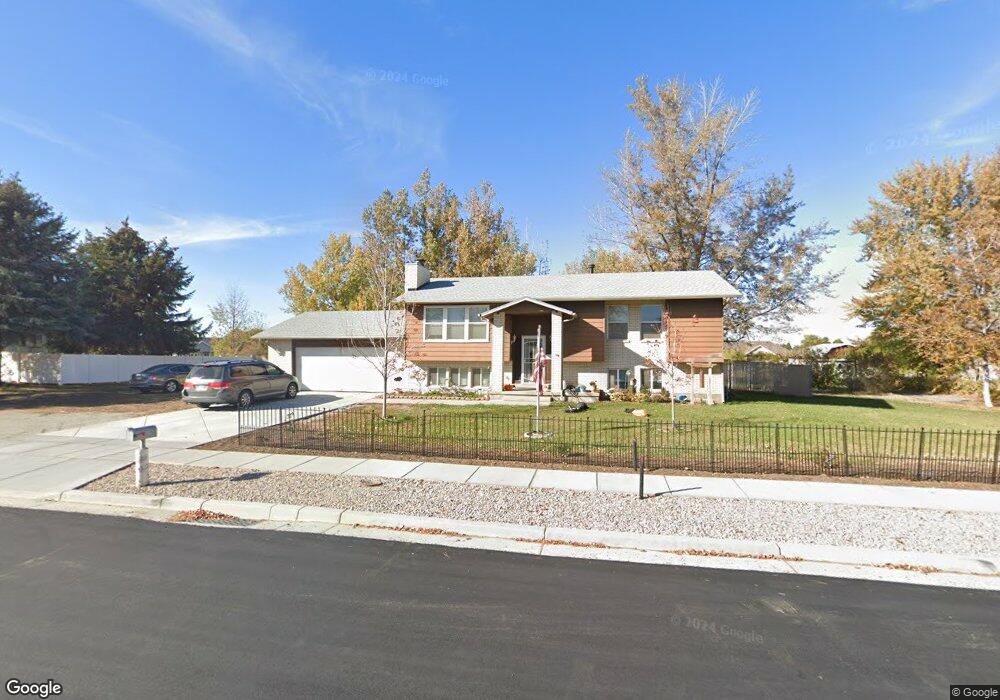
971 N 2600 W Clearfield, UT 84015
Estimated Value: $520,000 - $541,000
5
Beds
3
Baths
2,580
Sq Ft
$206/Sq Ft
Est. Value
About This Home
This home is located at 971 N 2600 W, Clearfield, UT 84015 and is currently estimated at $531,935, approximately $206 per square foot. 971 N 2600 W is a home located in Davis County with nearby schools including Lakeside School, West Point Junior High School, and Syracuse High School.
Ownership History
Date
Name
Owned For
Owner Type
Purchase Details
Closed on
Mar 8, 2024
Sold by
Mccain Jason M and Mccain Michelle L
Bought by
Cox Samuel Gregory and Cox Megan Kris
Current Estimated Value
Home Financials for this Owner
Home Financials are based on the most recent Mortgage that was taken out on this home.
Original Mortgage
$447,509
Outstanding Balance
$439,718
Interest Rate
6.69%
Mortgage Type
New Conventional
Estimated Equity
$92,217
Purchase Details
Closed on
Dec 29, 2014
Sold by
Cross John M and Cross Denise R
Bought by
Mccain Jason M and Mccain Michelle L
Home Financials for this Owner
Home Financials are based on the most recent Mortgage that was taken out on this home.
Original Mortgage
$211,105
Interest Rate
3.87%
Mortgage Type
FHA
Purchase Details
Closed on
Jun 25, 2007
Sold by
Cross John M
Bought by
Cross John M and Cross Denise R
Purchase Details
Closed on
Jan 26, 2006
Sold by
Cross Lillian I
Bought by
Cross John M
Create a Home Valuation Report for This Property
The Home Valuation Report is an in-depth analysis detailing your home's value as well as a comparison with similar homes in the area
Home Values in the Area
Average Home Value in this Area
Purchase History
| Date | Buyer | Sale Price | Title Company |
|---|---|---|---|
| Cox Samuel Gregory | -- | Old Republic Title | |
| Mccain Jason M | -- | Mountain View Title | |
| Cross John M | -- | None Available | |
| Cross John M | -- | None Available |
Source: Public Records
Mortgage History
| Date | Status | Borrower | Loan Amount |
|---|---|---|---|
| Open | Cox Samuel Gregory | $447,509 | |
| Previous Owner | Mccain Jason M | $211,105 |
Source: Public Records
Tax History Compared to Growth
Tax History
| Year | Tax Paid | Tax Assessment Tax Assessment Total Assessment is a certain percentage of the fair market value that is determined by local assessors to be the total taxable value of land and additions on the property. | Land | Improvement |
|---|---|---|---|---|
| 2025 | $2,654 | $255,200 | $167,639 | $87,561 |
| 2024 | $2,595 | $250,800 | $173,906 | $76,894 |
| 2023 | $1,249 | $485,000 | $216,318 | $268,682 |
| 2022 | $2,030 | $286,000 | $110,707 | $175,293 |
| 2021 | $1,748 | $407,000 | $176,348 | $230,652 |
| 2020 | $1,424 | $355,000 | $174,126 | $180,874 |
| 2019 | $1,329 | $334,000 | $160,344 | $173,656 |
| 2018 | $1,169 | $305,000 | $130,544 | $174,456 |
| 2016 | $856 | $137,610 | $55,169 | $82,441 |
| 2015 | $1,802 | $123,365 | $55,169 | $68,196 |
| 2014 | $1,803 | $125,373 | $55,169 | $70,204 |
| 2013 | -- | $115,254 | $44,446 | $70,808 |
Source: Public Records
Map
Nearby Homes