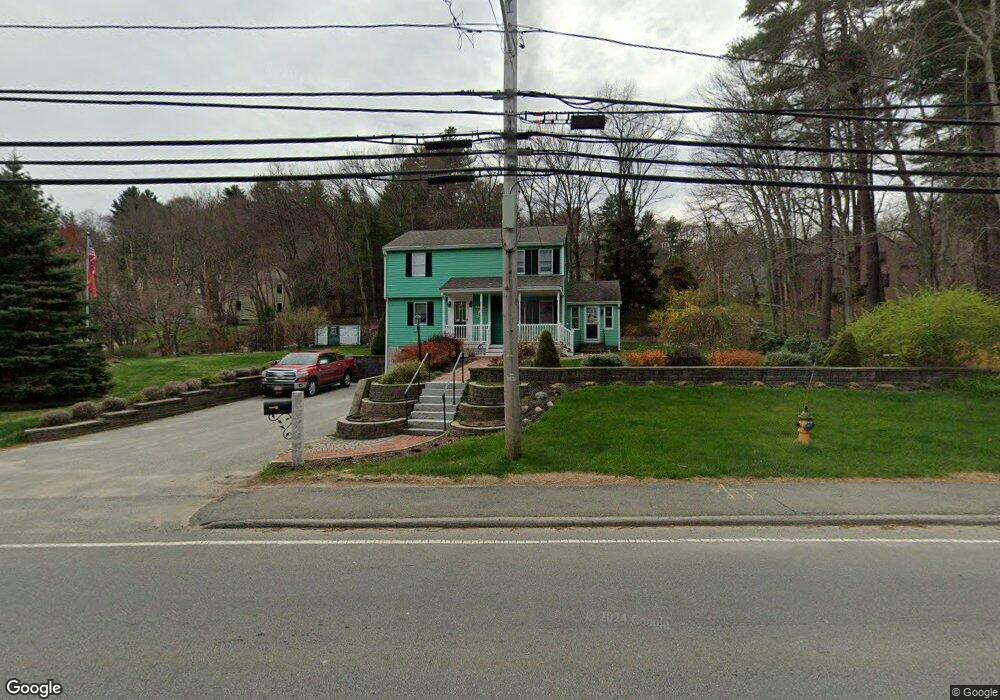
971 Salem St North Andover, MA 01845
Estimated Value: $734,486 - $922,000
3
Beds
2
Baths
1,792
Sq Ft
$452/Sq Ft
Est. Value
About This Home
This home is located at 971 Salem St, North Andover, MA 01845 and is currently estimated at $809,372, approximately $451 per square foot. 971 Salem St is a home located in Essex County with nearby schools including Annie L Sargent Elementary School, North Andover Middle School, and North Andover High School.
Ownership History
Date
Name
Owned For
Owner Type
Purchase Details
Closed on
Dec 28, 1995
Sold by
Summer Street Rt
Bought by
Conti Aron C
Current Estimated Value
Home Financials for this Owner
Home Financials are based on the most recent Mortgage that was taken out on this home.
Original Mortgage
$167,400
Interest Rate
7.33%
Mortgage Type
Purchase Money Mortgage
Purchase Details
Closed on
Oct 13, 1994
Sold by
Stcyr Gerard C
Bought by
Summer Street Rt
Create a Home Valuation Report for This Property
The Home Valuation Report is an in-depth analysis detailing your home's value as well as a comparison with similar homes in the area
Home Values in the Area
Average Home Value in this Area
Purchase History
| Date | Buyer | Sale Price | Title Company |
|---|---|---|---|
| Conti Aron C | $186,000 | -- | |
| Summer Street Rt | $240,000 | -- |
Source: Public Records
Mortgage History
| Date | Status | Borrower | Loan Amount |
|---|---|---|---|
| Open | Summer Street Rt | $141,500 | |
| Closed | Summer Street Rt | $155,750 | |
| Closed | Summer Street Rt | $167,400 | |
| Previous Owner | Summer Street Rt | $103,921 |
Source: Public Records
Tax History Compared to Growth
Tax History
| Year | Tax Paid | Tax Assessment Tax Assessment Total Assessment is a certain percentage of the fair market value that is determined by local assessors to be the total taxable value of land and additions on the property. | Land | Improvement |
|---|---|---|---|---|
| 2025 | $7,008 | $622,400 | $319,800 | $302,600 |
| 2024 | $6,603 | $595,400 | $301,000 | $294,400 |
| 2023 | $6,487 | $530,000 | $276,500 | $253,500 |
| 2022 | $6,285 | $464,500 | $248,300 | $216,200 |
| 2021 | $6,028 | $425,400 | $225,800 | $199,600 |
| 2020 | $5,845 | $425,400 | $225,800 | $199,600 |
| 2019 | $5,705 | $425,400 | $225,800 | $199,600 |
| 2018 | $6,181 | $425,400 | $225,800 | $199,600 |
| 2017 | $5,462 | $382,500 | $191,100 | $191,400 |
| 2016 | $5,176 | $362,700 | $187,500 | $175,200 |
| 2015 | $5,188 | $360,500 | $181,100 | $179,400 |
Source: Public Records
Map
Nearby Homes
- 10 Woodchuck Ln
- 45 Thistle Rd
- Lot 10 Stonecleave Rd
- 75 Thistle Rd
- 114 Stonecleave Rd
- 12 Farnum St
- 495 Johnson St
- 378 Salem St
- 590 Foster St
- 121 Cortland Dr
- 141 Cortland Dr Unit 141
- 141 Cortland Dr
- 80 Sandra Ln
- 7 Sullivan St
- 124 Hillside Rd
- 76 Hillside Rd
- 851 Forest St
- 174 Chestnut St Unit 14
- 124 Quail Run Rd
- 136 Quail Run Rd
- 38 Foxwood Dr
- 968 Salem St
- 15 Huckleberry Ln
- 28 Foxwood Dr
- 10 Foxwood Dr
- 23 Huckleberry Ln
- 989 Salem St
- LOT 11 Foxwood
- LOT 29 Foxwood Dr
- 30 Huckleberry Ln
- LOT 21 Foxwood Dr
- LOT 23 Foxwood Dr
- 55 Foxwood Dr
- 31 Huckleberry Ln
- 996 Salem St
- 998 Salem St
- 19 Foxwood Dr
- 19 Foxwood Dr Unit 1
- 19 Foxwood Dr
- 9 Foxwood Dr